'%3e%3cpath%20d='M72%200H0V72H72V0Z'%20fill='%23D81E04'/%3e%3cpath%20d='M16.656%2048.9837C13.5894%2048.9837%2011.0957%2051.4736%2011.0957%2054.5308C11.0957%2057.5879%2013.5875%2060.0797%2016.656%2060.0797C19.7244%2060.0797%2022.1917%2057.5784%2022.1917%2054.5308C22.1917%2051.4831%2019.6999%2048.9837%2016.656%2048.9837ZM16.656%2056.7087C15.4498%2056.7087%2014.4667%2055.7294%2014.4667%2054.5308C14.4667%2053.3321%2015.4498%2052.3528%2016.656%2052.3528C17.8622%2052.3528%2018.8302%2053.3321%2018.8302%2054.5308C18.8302%2055.7294%2017.8376%2056.7087%2016.656%2056.7087ZM54.0881%2049.2446H50.8306V59.7961H54.1335V55.8863C54.1335%2055.4609%2054.1297%2054.9013%2054.0257%2054.2226L57.6349%2059.798H60.9056V49.2465H57.6046V53.0088C57.6046%2053.4664%2057.6179%2054.0241%2057.7143%2054.6877L54.0881%2049.2465V49.2446ZM43.5404%2023.2733L48.628%2028.361C50.7852%2030.5068%2054.7668%2030.798%2057.3381%2028.2456L48.5184%2019.426L47.9758%2018.8871C45.8186%2016.7394%2042.9297%2015.5332%2039.8859%2015.5332H31.6485C28.0393%2015.5332%2024.9576%2018.1895%2024.4623%2021.7571H39.8915C41.266%2021.7571%2042.5724%2022.294%2043.5404%2023.2715V23.2733ZM32.4879%2024.3397C32.4879%2025.9977%2033.8359%2027.3457%2035.494%2027.3457C37.1521%2027.3457%2038.5001%2025.9996%2038.5001%2024.3397C38.5001%2023.8008%2038.3583%2023.2658%2038.0728%2022.7969H32.9057C32.6335%2023.2658%2032.4879%2023.8008%2032.4879%2024.3397ZM33.6979%2049.2446V59.7961H40.6988V56.928H37.3789V49.2465H33.6979V49.2446ZM21.2577%2029.0208H24.2354C25.2998%2029.0208%2026.3869%2029.4727%2027.1507%2030.2289L41.249%2044.3309C43.6784%2041.9147%2043.6784%2037.9293%2041.249%2035.5094L31.6315%2025.8899C29.6671%2023.9199%2027.0373%2022.7969%2024.2619%2022.7969H23.3582C19.9078%2022.7969%2017.1267%2025.5875%2017.1267%2029.0359C17.1267%2030.382%2017.5275%2031.4181%2018.2119%2032.5581C17.9605%2030.7167%2019.3917%2029.0208%2021.2558%2029.0208H21.2577ZM45.2344%2055.6008H47.4634V53.1525H45.2344V51.8215H49.3597V49.2427H41.8332V59.7942H49.6981V56.9262H45.2344V55.6008ZM29.8505%2055.4969C31.0397%2055.357%2031.8262%2054.3096%2031.8262%2052.8027C31.8262%2050.5473%2030.4158%2049.2446%2027.6801%2049.2446H23.3639V59.7961H26.6667V56.3079L28.459%2059.7961H32.5919L29.8505%2055.4969ZM27.3039%2054.1451H26.6667V51.8518H27.3039C28.1074%2051.8518%2028.5233%2052.2998%2028.5233%2053.0202C28.5233%2053.7405%2028.0866%2054.1451%2027.3039%2054.1451Z'%20fill='white'/%3e%3c/g%3e%3cdefs%3e%3cclipPath%20id='clip0_477_203'%3e%3crect%20width='72'%20height='72'%20fill='white'/%3e%3c/clipPath%3e%3c/defs%3e%3c/svg%3e)
- Home
- Management Report
- Our Performance in 2025
- Downstream
Downstream
The ORLEN Group’s Downstream segment comprises two business lines: Refining and Petrochemicals.
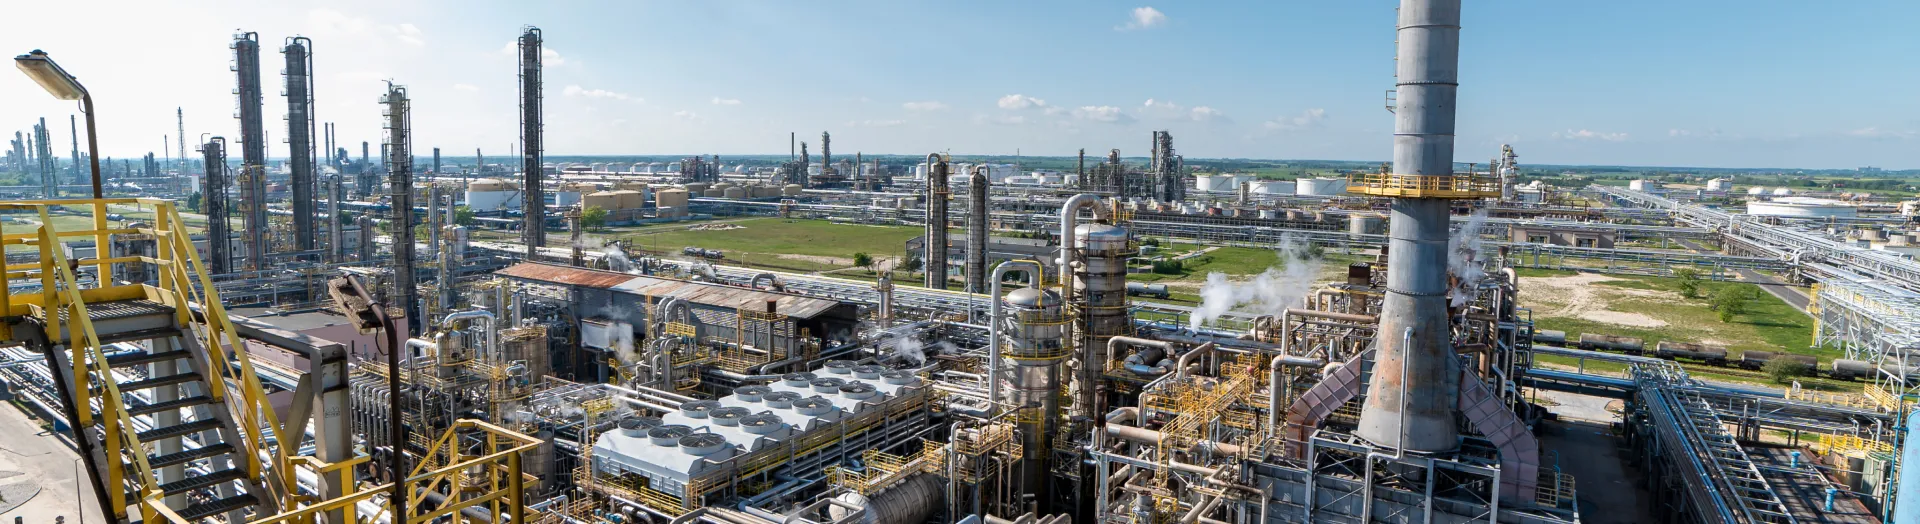
We are a leader in the fuel and petrochemicals market in Central and Eastern Europe. Our refining business includes the processing of crude oil into products and wholesale sale of fuels across a number of European markets. We own seven refineries in Poland, Lithuania and the Czech Republic, with a combined annual processing capacity of 42.6 million tonnes of crude oil (approximately 860,000 bbl/d). A key competitive advantage of these refineries is their location, with access to oil and product pipelines as well as marine terminals, enabling diversification of oil supplies and facilitating the import and export of petroleum products. Our petrochemical assets are fully integrated with our refining operations, allowing us to extend the value chain.
The ORLEN Group produces a broad range of petrochemical products, including monomers, polymers, aromatics, PVC, PTA and fertilisers. Our petrochemical products are sold in more than 60 countries. We are the only producer of LDPE in Poland and we are able to meet around 30% of domestic demand.
ORLEN Group business model by segment

Financial results
Financial highlights of the Downstream segment
| [PLN million] | 2025 | 2024 | change |
|---|---|---|---|
| Segment revenue, including: | 125,007 | 141,688 | (16,681) |
| Revenue from external customers | 96,639 | 108,974 | (12,335) |
| Inter-segment revenue | 28,368 | 32,714 | (4,346) |
| Segment costs | (119,766) | (137,482) | 17,716 |
| Other operating income | 2,715 | 4,653 | (1,938) |
| Net other operating income/(expenses) | (14,279) | (17,009) | 2,730 |
| (Impairment loss)/ reversal of impairment loss on trade and other receivables | 21 | (53) | 74 |
| LIFO-based EBITDA excluding impairment losses | 9,616 | 7,032 | 2,584 |
| LIFO-based EBITDA | (2,703) | (5,534) | 2,831 |
| EBITDA | (3,488) | (5,570) | 2,082 |
| Operating profit (EBIT) | (6,302) | (8,203) | 1,901 |
| Capex | 9,643 | 12,271 | (2,628) |
LIFO-based EBITDA by business line [PLN million]
Refining
PLN 10.3 billion [up PLN 2.4 billion]
- (+) higher crude throughput
- (+) improved refining margin
- (+) higher sales volumes
- (-) appreciation of the PLN against the USD
Petrochemicals
PLN – 0.7 billion [up PLN 0.2 billion]
- (+) appreciation of the EUR against the USD
- (+) no adverse impact from the restructuring provision at Spolana recognised in 2024
- (-) lower petrochemical margin; increase in fertiliser margins
- (-) lower sales volumes
Sales of the Downstream segment by product [PLN million, thousand tonnes]
| 2025 | 2024 | 2025 | 2024 | |
|---|---|---|---|---|
| PLN million | PLN million | thousand tonnes | thousand tonnes | |
| Light distillates | 17,103 | 18,994 | 5,981 | 5,737 |
| Middle distillates | 52,760 | 58,120 | 17,161 | 16,755 |
| Heavy fractions | 8,205 | 10,179 | 4,693 | 5,067 |
| Monomers | 2,726 | 3,237 | 694 | 771 |
| Polymers | 2,660 | 3,470 | 575 | 699 |
| Aromatics | 924 | 1,457 | 329 | 355 |
| PTA | 1,143 | 1,820 | 408 | 575 |
| Plastics | 743 | 972 | 189 | 248 |
| Fertilisers | 1,285 | 1,350 | 975 | 1,119 |
| Other | 9,080 | 9,375 | 4,902 | 4,871 |
| Total | 96,629 | 108,974 | 35,866 | 36,196 |
Refining sales by product and by country [thousand tonnes]
| 2025 | 2024 | Change | |
|---|---|---|---|
| Total | 31,757 | 31,416 | 1% |
| Gasolines | 5,320 | 5,159 | 3% |
| Diesel oil | 15,007 | 14,767 | 2% |
| LPG | 661 | 578 | 14% |
| JET fuel | 1,932 | 1,775 | 9% |
| Heavy fuel oil | 2,313 | 2,851 | -19% |
| Other | 6,524 | 6,288 | 4% |
| Total | 31,757 | 31,416 | 1% |
| Poland | 18,245 | 18,202 | 0% |
| Czech Republic | 3,335 | 3,559 | -6% |
| Lithuania | 5,622 | 5,121 | 10% |
| Switzerland – ORLEN Switzerland's operations | 4,556 | 4,534 | 0% |
In 2025, we engaged in wholesale distribution of refining products in Poland, the Czech Republic, Slovakia, Hungary, Germany, Austria, Latvia, Lithuania, Estonia, and Ukraine, as well as in other international markets, where products were delivered by sea. Our home markets are Poland, Lithuania and the Czech Republic. We have an extensive portfolio of refining products, including gasolines, diesel oil, aviation fuel, light and heavy fuel oil, bitumen, engine oils and a wide range of non-fuel products and intermediates.
In 2025, the Polish fuel market remained strongly influenced by geopolitical and regulatory factors, including trends seen in previous years and new policy signals from the United States. EU sanctions on imports of crude oil and fuels from Russia and Belarus remained in force, necessitating further diversification of supply sources and increasing the role of feedstock from the Middle East, the United States and Africa. At the same time, the economic slowdown in Germany continued to put import pressure on the Polish market from that direction. Global markets were also affected by instability in the Middle East, in particular the ongoing tensions between Israel and Iran, the conflict in Gaza, threats to shipping in the Red Sea, and the risk of temporary supply constraints among OPEC+ countries, all of which added to crude oil price volatility. Another factor in 2025 was action taken by Donald Trump’s administration, resulting in tighter sanctions on Russia and economic pressure on selected countries already subject to restrictions. Tougher sanctions on Russia’s energy sector increased the geopolitical risk premium in the oil market, although Russia, as in previous years, largely maintained crude exports to Asia, chiefly to China and India. Fuel exports from Poland to Ukraine remained at a high level in 2025, making a significant contribution to the supply balance of domestic producers, including the ORLEN Group and other market participants.
In 2025, fuel consumption in Poland increased by 2.2% year on year, broadly in line with 2024. Gasoline consumption rose by 7.7% year on year, supported by lower inflation and the resulting increase in real wages. Diesel oil consumption edged up by 0.3% year on year. Consumption of light fuel oil fell by 4.5%, partly due to the high base in 2024 resulting from uncertainty over sanctions on gas imports from Russia. Market conditions in the aviation sector remained favourable, with consumption rising by 7.7% year on year.
In 2025, our Refining sales on the Polish market totalled 18,245 thousand tonnes, comparable with the previous year.
Sales of light distillates increased by 4% year on year, driven by higher sales of both gasoline and LPG. Sales of middle distillates rose by 1% year on year, reflecting broadly stable diesel oil sales and an 8% year-on-year increase in aviation fuel sales. Sales of heavy fuel oil in Poland were 3% lower year on year.
In 2025, both gasoline and diesel oil consumption in the Czech market increased by 1.5% year on year. The strongest growth was recorded in aviation fuel, with consumption up 4% year on year. The continued upward trend in aviation fuel demand pushed consumption above the record level seen before the pandemic in 2019. Rising consumption was supported by favourable macroeconomic conditions in the Czech Republic, with GDP growing at 2.3%, 1.1 percentage points higher than in 2024.
Refining sales in the Czech market fell by 6% year on year. Gasolines sales were down by 9% and diesel oil sales down by 7% year on year, partly due to supply constraints. in the first half of 2025, ORLEN Unipetrol’s production was affected by prolonged maintenance shutdowns at the Kralupy and Litvínov refineries, and in the third quarter it was limited by power supply interruptions and failures at the petrochemical complex. In addition, supplies of Russian crude oil via the Druzhba pipeline were halted from the beginning of March 2025. During the transition period before increased transmission capacity on the TAL/IKL pipeline became available in May, the refineries relied on crude oil from strategic reserves. The external environment was not supportive either, with an oversupply of diesel oil in the region and pressure from local importers in the Czech market, as well as in the export markets of Slovakia and Hungary. The largest import volumes came from Germany, which further strengthened its dominant position compared with the previous year. Despite these supply-side challenges, we continued deliveries to the Czech market and export markets, both in the wholesale channel and for the Group’s own retail network in the Czech Republic, Slovakia, Hungary, Germany and Austria. Furthermore, ORLEN Unipetrol executed intra-group transfers to the Polish market, aiding in the optimisation of the Group’s product balance.
In 2025, we also continued A-1 aviation fuel sales at the Prague airport and obtained a licence for providing into-plane refuelling services at that location. The services will be launched on 1 January 2026. The company recorded a 2% year-on-year increase in Jet A-1 aviation fuel sales.
In 2025, key macroeconomic indicators improved, particularly in Latvia and Estonia, where GDP had contracted the year before. The stronger macroeconomic backdrop was reflected in fuel consumption. Gasoline consumption rose by 2% year on year. In Latvia, it increased by 5% year on year, while diesel oil consumption was up 1.4%. In Estonia, gasoline consumption was only slightly below the previous year’s level, while diesel oil consumption rose by 2% year on year. All three markets also recorded strong growth in the consumption of aviation fuel. The exception was diesel oil consumption in Lithuania, which fell by around 13% year on year, mainly due to the unprecedented increase in excise duty introduced at the beginning of 2025 (up EUR +110 per 1,000 litres). As a result, the enduser price of the product became the highest in the region, prompting consumers to seek more costeffective alternatives. The Baltic markets were also affected by a regional oversupply. Higher fuel excise duties across all Baltic markets and in Ukraine constrained consumption in the first quarter of 2025, but conditions improved later in the year, with sales rising as customers gradually ran down inventories built up in 2024.
In 2025, ORLEN Lietuva reported a 10% year-on-year growth in Refining sales, which reached 5,622 thousand tonnes. Gasoline sales expanded by 38% year on year, reflecting the upward trend in consumption of this fuel, supported by rising sales of vehicles with spark-ignition gasoline engines, including hybrid vehicles. Meanwhile, sales of diesel oil were down 1% year on year. Bitumen sales increased by around 37% year on year in 2025, reaching a record level. ORLEN Lietuva successfully completed a project to build a unit for the physical blending of SAF biofuel with Jet A-1. After the process was launched in September, it achieved the required 2% SAF content target for all aviation customers in the Baltic region.
We continued supplying fuels to the Ukrainian market from both Lithuania and Poland. In 2025, we sold record-high volumes of gasoline and diesel oil from our refineries in Lithuania and Poland, significantly exceeding 2.2 million tonnes. As a result, the ORLEN Group became the largest fuel supplier in that market. In April 2025, we successfully launched sales of E5 gasoline, which led to a significant increase in sales volumes of this fuel. We also made the first-ever deliveries of Jet A-1 aviation fuel from the Płock refinery. Alongside fuel sales, we are also active in the bitumen and lubricant segments. There is growing interest in expanding cooperation with the ORLEN Group in refining, petrochemicals, upstream and energy.
ORLEN Lietuva was an important contributor to balancing shortages in the Polish market. Significant quantities of diesel oil and gasolines were delivered in 2025 both via land, through the Mockava transshipment terminal, and by sea.
| 2025 | 2024 | Change | |
|---|---|---|---|
| Total | 4,108 | 4,779 | -14% |
| Olefins | 694 | 771 | -10% |
| Polyolefins | 575 | 699 | -18% |
| Fertilisers | 975 | 1,119 | -13% |
| PVC | 189 | 248 | -24% |
| PTA | 408 | 575 | -29% |
| Other | 1,267 | 1,367 | -7% |
| Total | 4,108 | 4,779 | -14% |
| Poland | 2,857 | 3,264 | -12% |
| Czech Republic | 1,191 | 1,450 | -18% |
| Lithuania | 60 | 65 | -8% |
In 2025, sales volumes of our key petrochemical products, including monomers, polymers, aromatics, fertilisers, plastics and PTA, totalled 3,128 thousand tonnes, down 17% year on year. The sharpest declines were recorded in plastics (down 24% year on year) and PTA (down 29% year on year), driven by production issues, lower demand from European customers, and intensifying competition from imports.
Fertiliser sales fell by 17% year on year in 2025, mainly due to the shutdown of the ammonium sulphate plant at Spolana in the Czech Republic.
2025 was marked by a challenging market environment, which led to lower contract and spot prices and, as a result, affected our ability to achieve target margins and place higher volumes on the market. Customers for our petrochemical products include Polish and international manufacturing companies operating across Europe. These products are used in most key industries, including construction, textiles, packaging and automotive.
Refining operations
Total annual throughput capacity of the ORLEN Group’s refineries stands at 42.6 million tonnes.
In 2025, we processed 39.6 million tonnes of crude, a increase of 3% year on year, including:
- in Poland – throughput volumes broadly on a par year on year;
- in the Czech Republic – throughput rose by 7% year on year, driven by very strong refining margins, high fuel demand, and the absence of the negative effect of the scheduled shutdown at the Litvínov refinery that occurred in 2024;
- in Lithuania – throughput increased by 6% year on year, supported by a favourable macroeconomic environment.
Crude oil throughput [thousand tonnes] and capacity utilisation [%]
Crude throughput at the ORLEN Group
Capacity utilisation at ORLEN Unipetrol
Capacity utilisation at ORLEN Lietuva
ORLEN Group’s refining production by country [thousand tonnes]
| 2025 | 2024 | Change % | |
|---|---|---|---|
| Total | 37,783 | 37,656 | 0% |
| Poland | 21,709 | 22,582 | -4% |
| Czech Republic | 7,167 | 6,694 | 7% |
| Lithuania | 8,907 | 8,380 | 6% |
We source crude oil for processing through a combination of long-term contracts and spot purchases.
Long-term contracts account for around 55% of the supplies.
In 2025, under our contractual arrangements, we purchased crude oil:
- delivered by sea, from Saudi Aramco (Saudi Arabia), BP and Equinor (Norway);
- delivered via pipeline, from Rosneft in Russia, with that contract expiring in June 2025.
The main crude grades processed by our refineries are Arab Light, Johan Sverdrup and Azeri Light.
ORLEN Group’s fuel market shares in Poland
Source: In-house analysis.
- Our market shares declined as fuel consumption in Poland rose, while the Polish refineries maintained a stable, very high output.
- We remain the main supplier for major foreign fuel companies operating in Poland (BP, Shell, Amic, Circle K).
ORLEN Group’s fuel market shares in the Czech Republic
Source: In-house analysis.
- Despite supply disruptions at our refinery in the Czech Republic, our combined market share reached 48%.
- The year-on-year decline of approximately 5 percentage points was due to the production-related constraints and a pronounced oversupply of fuel products, especially diesel oil, in the region.
ORLEN Group’s fuel market shares in the Baltic states
Source: In-house analysis
Lithuania
- We maintained our leading position in the gasoline market, with market share broadly unchanged year on year.
- Our share of the diesel market contracted by around 5 percentage points, the reason being a substantial increase in fuel excise duty in 2025, which reduced consumption among some ORLEN Lietuva customers in the agricultural and international transport sectors, as well pressure from importers and aggressive pricing by competitors from Scandinavia.
Latvia
- Our combined share of the gasoline and diesel oil markets expanded by approximately 1 percentage point year on year.
Estonia
- We significantly improved our combined market share, by approximately 12 percentage points, mainly on the back of a strong gain in the diesel oil segment, as international transport operators chose to refuel in Estonia rather than Lithuania, which became the region’s most expensive market following the excise duty increase.
Petrochemicals operations
ORLEN is the only producer of ethylene glycols and purified terephthalic acid (PTA) in Central Europe, and a major manufacturer of monomers and polymers. ORLEN Group’s petrochemical operations are concentrated in two main locations: Płock in Poland and Litvínov in the Czech Republic.
The combined production capacity of our assets in Poland and the Czech Republic (including a 50% share in BOP) is approximately 700 thousand tonnes annually for polyethylene (annual production capacities in Europe: approximately 16 million tonnes), and some 600 thousand tonnes annually for polypropylene (annual production capacities in Europe: approximately 11 million tonnes). ORLEN is the only manufacturer in Europe to have PTA production units fully integrated with paraxylene production, and its annual PTA production capacity stands at 690 thousand tonnes (nameplate production capacities in Europe: approximately 2 million tonnes annually). With our annual plastics production capacity of 475 thousand tonnes, we rank fifth on the European market (nameplate production capacities in Europe: approximately 6.5 million tonnes annually).
ORLEN Group’s petrochemical production by country [thousand tonnes]
| 2025 | 2024 | Change % | |
|---|---|---|---|
| Total | 5,892 | 7,123 | -17% |
| Poland | 3,522 | 4,069 | -13% |
| Czech Republic | 2,310 | 2,987 | -23% |
| Lithuania | 60 | 66 | -9% |
Polyethylene manufacturers in Europe in 2025
* Including a 50% interest in BOP.
Source: In-house analysis based on Market Analytics: Polyolefins (December Update) – 2025 (Nexant).
Polypropylene manufacturers in Europe in 2025
* Including a 50% interest in BOP.
Source: In-house analysis based on Market Analytics: Polyolefins (December Update) – 2025 (Nexant).
PVC manufacturers in Europe in 2025
Source: In-house analysis based on Market Analytics – Vinyls – 2025 (Nexant).
PTA manufacturers in Europe in 2025
Source: In-house analysis based on Market Analytics – Vinyls – 2025 (Nexant).