'%3e%3cpath%20d='M72%200H0V72H72V0Z'%20fill='%23D81E04'/%3e%3cpath%20d='M16.656%2048.9837C13.5894%2048.9837%2011.0957%2051.4736%2011.0957%2054.5308C11.0957%2057.5879%2013.5875%2060.0797%2016.656%2060.0797C19.7244%2060.0797%2022.1917%2057.5784%2022.1917%2054.5308C22.1917%2051.4831%2019.6999%2048.9837%2016.656%2048.9837ZM16.656%2056.7087C15.4498%2056.7087%2014.4667%2055.7294%2014.4667%2054.5308C14.4667%2053.3321%2015.4498%2052.3528%2016.656%2052.3528C17.8622%2052.3528%2018.8302%2053.3321%2018.8302%2054.5308C18.8302%2055.7294%2017.8376%2056.7087%2016.656%2056.7087ZM54.0881%2049.2446H50.8306V59.7961H54.1335V55.8863C54.1335%2055.4609%2054.1297%2054.9013%2054.0257%2054.2226L57.6349%2059.798H60.9056V49.2465H57.6046V53.0088C57.6046%2053.4664%2057.6179%2054.0241%2057.7143%2054.6877L54.0881%2049.2465V49.2446ZM43.5404%2023.2733L48.628%2028.361C50.7852%2030.5068%2054.7668%2030.798%2057.3381%2028.2456L48.5184%2019.426L47.9758%2018.8871C45.8186%2016.7394%2042.9297%2015.5332%2039.8859%2015.5332H31.6485C28.0393%2015.5332%2024.9576%2018.1895%2024.4623%2021.7571H39.8915C41.266%2021.7571%2042.5724%2022.294%2043.5404%2023.2715V23.2733ZM32.4879%2024.3397C32.4879%2025.9977%2033.8359%2027.3457%2035.494%2027.3457C37.1521%2027.3457%2038.5001%2025.9996%2038.5001%2024.3397C38.5001%2023.8008%2038.3583%2023.2658%2038.0728%2022.7969H32.9057C32.6335%2023.2658%2032.4879%2023.8008%2032.4879%2024.3397ZM33.6979%2049.2446V59.7961H40.6988V56.928H37.3789V49.2465H33.6979V49.2446ZM21.2577%2029.0208H24.2354C25.2998%2029.0208%2026.3869%2029.4727%2027.1507%2030.2289L41.249%2044.3309C43.6784%2041.9147%2043.6784%2037.9293%2041.249%2035.5094L31.6315%2025.8899C29.6671%2023.9199%2027.0373%2022.7969%2024.2619%2022.7969H23.3582C19.9078%2022.7969%2017.1267%2025.5875%2017.1267%2029.0359C17.1267%2030.382%2017.5275%2031.4181%2018.2119%2032.5581C17.9605%2030.7167%2019.3917%2029.0208%2021.2558%2029.0208H21.2577ZM45.2344%2055.6008H47.4634V53.1525H45.2344V51.8215H49.3597V49.2427H41.8332V59.7942H49.6981V56.9262H45.2344V55.6008ZM29.8505%2055.4969C31.0397%2055.357%2031.8262%2054.3096%2031.8262%2052.8027C31.8262%2050.5473%2030.4158%2049.2446%2027.6801%2049.2446H23.3639V59.7961H26.6667V56.3079L28.459%2059.7961H32.5919L29.8505%2055.4969ZM27.3039%2054.1451H26.6667V51.8518H27.3039C28.1074%2051.8518%2028.5233%2052.2998%2028.5233%2053.0202C28.5233%2053.7405%2028.0866%2054.1451%2027.3039%2054.1451Z'%20fill='white'/%3e%3c/g%3e%3cdefs%3e%3cclipPath%20id='clip0_477_203'%3e%3crect%20width='72'%20height='72'%20fill='white'/%3e%3c/clipPath%3e%3c/defs%3e%3c/svg%3e)
- Home
- Sustainability Statement
- Environment and Climate
- Climate Change [ESRS E1]
Climate Change [ESRS E1]
Climate change is a key strategic challenge, material to the long-term resilience of our business model, competitiveness and value creation.
In 2020, we committed to achieving climate neutrality by 2050, as reaffirmed in the ORLEN 2035 Strategy, thereby setting a clear long-term direction for our transformation.
This ambition is delivered through coordinated climate mitigation actions across our own operations and our value chain, including Scopes 1, 2 and 3 greenhouse gas emissions.
Our goal of achieving climate neutrality by 2050 is aligned with the Paris Agreement objective to limit global temperature increase to below 2°C above pre-industrial levels, while pursuing efforts to limit it to 1.5°C, as well as with EU climate policy, including the European Green Deal, which targets climate neutrality by 2050.
Climate governance
Decarbonisation and the energy transition are key strategic priorities within our corporate governance framework, underpinning the long-term resilience of our business model, value creation and alignment with EU climate policy. These matters are taken into account in decision-making at both management and supervisory levels, and form a core of our ORLEN 2035 Strategy4, the Climate Policy5, ORLEN Transition Plan6, and the Climate pillar of our Sustainable Development Strategy7.
Oversight of climate and sustainability matters rests with the Company’s highest governing bodies, including the Management Board and the Supervisory Board, which ensures their integration into strategic planning, risk and opportunity management, and capital allocation decisions. We view decarbonisation and the energy transition not only as regulatory requirements, but also as drivers of our long-term growth, new business lines, low- and zero-carbon technologies and enhanced competitiveness. Emission reduction targets are an integral part of our ORLEN 2035 Strategy, approved by the Management Board and the Supervisory Board. Progress in its implementation is reported regularly to the governing bodies.
Decarbonisation and energy transition objectives are also reflected in the variable remuneration framework for senior management. A portion of the remuneration of the Management Board and key management personnel is linked to the achievement of sustainability and energy transition objectives, including emission reduction targets and the implementation of the ORLEN Transition Plan. This directly aligns management accountability with the Group’s long-term climate ambition and stakeholder expectations.
For further details on the integration of sustainability-related performance targets into our remuneration system and on greenhouse gas emission reduction targets, see disclosure GOV-3.
4 ORLEN 2035 Strategy
5 ORLEN Group Climate Policy
6 ORLEN Transition Plan
7 ORLEN Group Sustainable Development Strategy
Transition plan for climate change mitigation [E1-1]
ORLEN Transition Plan
As part of our pathway to climate neutrality, we have developed and published the ORLEN Transition Plan, setting out our priorities, actions and investments supporting the energy transition and progress towards the climate neutrality goal8.
The Plan complements the ORLEN 2035 Strategy, published in early 2025, which defines our development path to 2035. Sustainability underpins our long-term business growth and is anchored in the energy transition.
8 The ORLEN Transition Plan was adopted by the ORLEN S.A. Management Board on 8 April 2025, as recorded in Minutes No. 1469/25 of the Management Board meeting, and by the Sustainability Committee of the Company’s Supervisory Board on 15 April 2025.
Strategic rationale for the transition

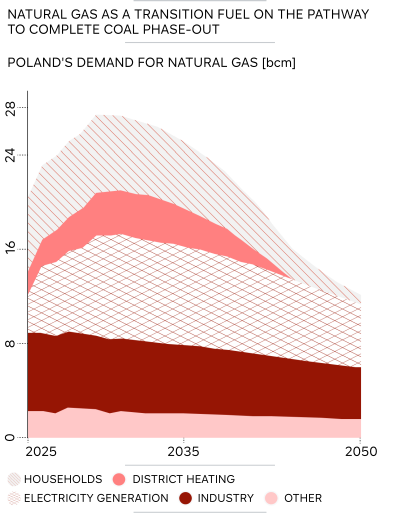
As natural plays a key role in the process of phasing out coal in Central Europe, we intend to further diversify our supply sources and increase own oil and gas production and supply volumes to support broader use of natural gas in the Energy segment and strengthen regional energy security.
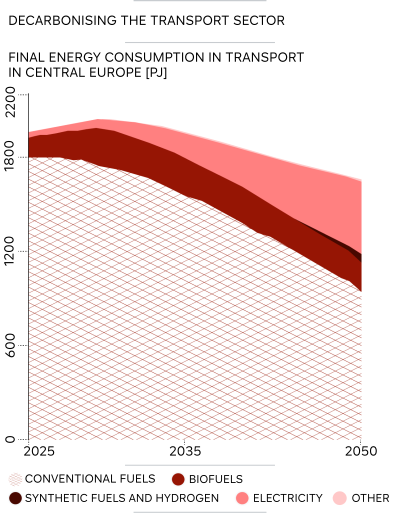
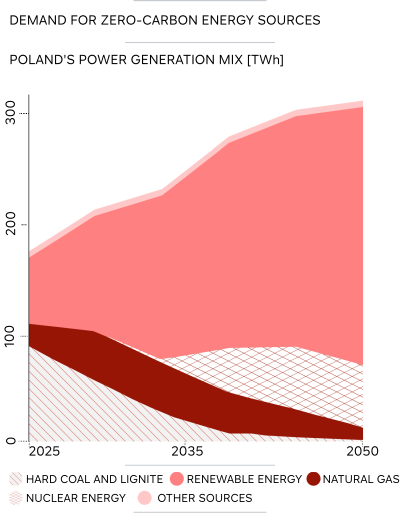
With regard to crude oil, and petroleum-based fuels in particular, which continue to play an important role in transport, we intend to keep refining throughput at a level consistent with regional demand for conventional fuels, in line with the scenarios adopted for our strategic planning, as described in disclosure ESRS 2 SBM-3. At the same time, those scenarios assume a gradual increase in the share of renewable energy in transport, both in the form of electricity and other alternative fuels. In parallel, we are developing new business areas, including CCUS, alternative fuels, mechanical and chemical recycling, renewable energy, nuclear power based on SMR technology, and energy storage. By 2035, we plan to fully phase out coal-based energy generation, with coal exiting the power generation mix by the end of 2030, in line with the Net Zero Emissions scenario9.
9 Based on the Net Zero Emissions scenario developed by the International Energy Agency and published in World Energy Outlook 2025.
Key assumptions of the ORLEN Transition Plan for the energy transition process
Decarbonisation targets
Our emission reduction targets, described in detail in disclosure E1-4, are a central component of the ORLEN Transition Plan and set out a measurable pathway for transforming our business towards a low- and zero-carbon economy. The short-, medium- and long-term targets support a phased reduction of greenhouse gas emissions across our key business segments, while preserving our energy security and financial stability. Their delivery helps align our operational, investment and technology initiatives with the ambition of achieving climate neutrality by 2050.

Alignment with 1.5°C pathway
We have set a long-term ambition for the ORLEN Group to achieve climate neutrality by 2050. At the same time, our emissions reduction pathway for Scope 1 and 2 emissions to 2030 and 2035 is aligned with a warming scenario above 2°C, while our near-term Scope 3 targets are aligned with a scenario above 2.5°C10. This reflects the continued material role of fossil fuels in our business model, including the development of natural gas production and the ongoing operation of our refining assets. As a result, emissions across our value chain, particularly Scope 3 (Category 11 – Use of sold products), which dominates our emissions profile, remain relatively high.
The pace at which we reduce our emissions is closely tied to the pace of the energy transition in Central Europe. The region remains highly dependent on fossil fuels, with a strong need to ensure energy security and limited availability of stable low-carbon alternatives in the short to medium term. In this context, natural gas serves as a transition fuel, while existing refining assets remain essential for maintaining energy and fuel supply. At the same time, economic convergence, relatively high energy intensity of GDP, and the need to sustain growth continue to drive demand for reliable and accessible energy in the region.
Our transition plan assumes continued use of natural gas as a transition fuel and the development of gas-fired generation, including CCGT units, to support energy security and system stability in Central Europe. While these measures contribute to lowering emissions intensity of the domestic energy mix, from the perspective of the ORLEN Group as the reporting entity, they limit our ability to achieve emissions reductions in line with the pace of decarbonisation assumed under a 1.5°C scenario, which requires faster and deeper reductions in fossil fuel use.
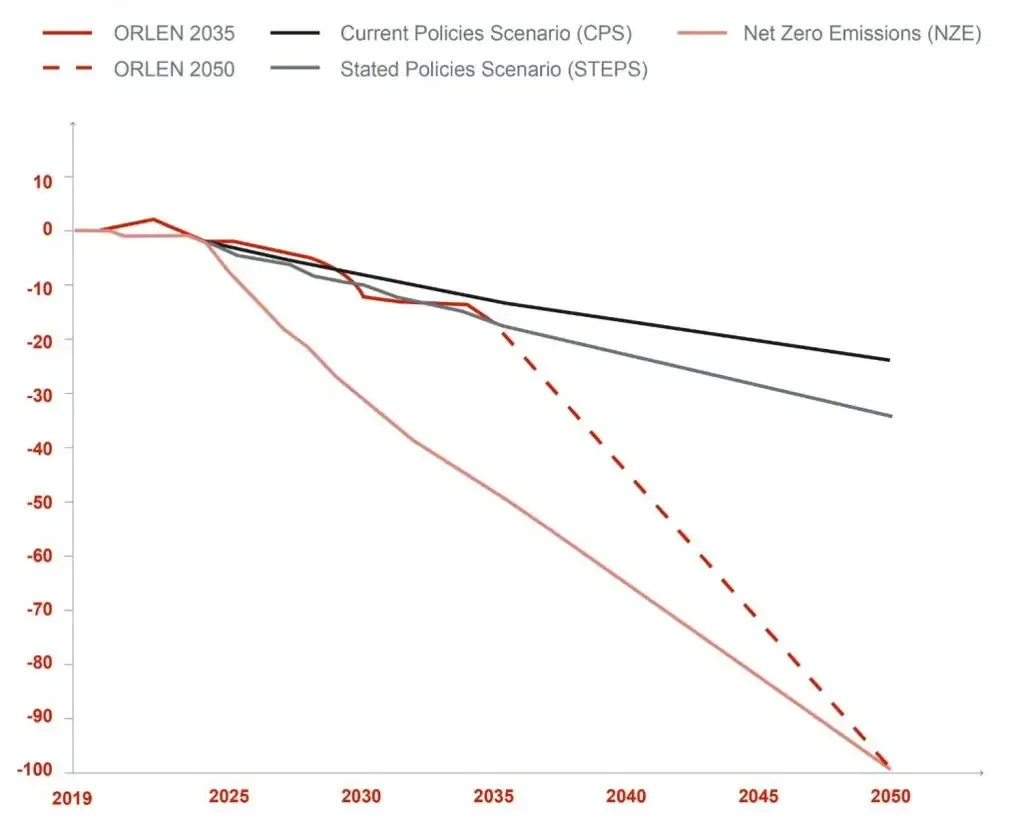
By 2035, based on reductions measured using the Net Carbon Intensity indicator – which in the 2019 base year covered 75% of the ORLEN Group’s Scope 1 and 2 emissions and 75% of Scope 3 Category 11 emissions – we expect to decarbonise at a pace broadly consistent with the IEA Stated Policies Scenario. The ORLEN 2035 Strategy and the ORLEN Transition Plan do not preclude achieving climate neutrality by 2050. Rather, they focus on enabling key investment decisions while maintaining flexibility for further transformation activities in the period 2036–2050. This reflects a phased approach to decarbonisation, with full alignment with a 1.5°C pathway expected beyond 2035.
Net Carbon Intensity reduction vs World Energy Outlook 2025 scenarios
 Source: in-house analysis based on World Energy Outlook 2025.
The primary benchmarks for assessing the ORLEN Group’s climate targets are provided by the International Energy Agency’s (IEA) scenarios set out in the World Energy Outlook, widely recognised as a credible source of long-term outlooks for the energy sector, in which we operate as an integrated energy group.
The analysis is based on a comparison of the ORLEN Group’s Net Carbon Intensity (NCI) against three IEA scenarios: the Current Policies Scenario (CPS) and the Stated Policies Scenario (STEPS), which reflect current and planned climate policies, respectively, as well as the Net Zero Emissions (NZE) scenario, which is aligned with a pathway limiting the increase in average global temperature to 1.5°C. For the purpose of presenting our emission reduction pathway, historical values were averaged for years where complete data was not available, making it possible to establish 2019 as the base year.
As shown in the chart, our NCI trajectory to 2030 and 2035 is broadly aligned with the STEPS scenario. Over the longer term, assuming climate neutrality is achieved by 2050, it converges with the more ambitious NZE pathway.
Our long-term climate ambition remains aligned with the Paris Agreement objective of limiting global temperature increase to well below 2°C above pre-industrial levels, while pursuing efforts to limit it to 1.5°C. Its delivery, however, will depend on further technological progress, the regulatory environment and demand-side developments shaping the pace of the energy transition, particularly in relation to value chain emissions. At the same time, the targets and actions planned to 2035 represent a transitional phase in our energy transition and will support the development of the operational and technological capabilities required for further emissions reductions beyond 2035. This includes the growing role of zero-carbon energy sources, the development of CCUS technologies, and initiatives to reduce emissions in hard-to-abate sectors, including transport.
ORLEN’s emission reduction pathway against IEA’s Net Zero Emissions (NZE) scenario
| 2030 (vs 2019) | 2035 (vs 2019) | 2050 (vs 2019) | ||
|---|---|---|---|---|
| IEA's Net Zero Emissions | Emissions Total emissions in NZE scenario | -31% | -51% | -100% |
| Energy supply Total energy supply in NZE scenario | 0% | -6% | -6% | |
| Emissions / energy supply | -31% | -48% | -100% | |
| ORLEN | Emissions Absolute Scope 1, Scope 2 and Scope 3 emissions included in NCI | -3% | -4% | |
| Energy supply ORLEN Group’s energy supply included in NCI | +10% | +13% | Net Zero ambition | |
| Net Carbon Intensity (gross) | -10% (10%) | -15% (-15%) |
Selected decarbonisation levers in own operations11


11 In-house analysis based on the ORLEN 2035 Strategy.
Key decarbonisation actions of the ORLEN Group to 2035
| Lever | Action | Time horizon |
|---|---|---|
| Transformation of the Downstream segment | Reduction of emissions from our Downstream operations through energy efficiency improvements, asset modernisation and use of lower-carbon energy sources, leading to a sustained decrease in emissions intensity of the refining and petrochemical assets. | Ongoing |
| Reduction of methane emissions | Implementation of a methane emissions reduction programme targeting Near-Zero Upstream Methane Emissions from operations that are under the control of ORLEN Group companies acting as project operators. | By 2030 |
| End of routine flaring | Elimination of routine flaring in upstream operations that are under the control of ORLEN Group companies acting as project operators. | By 2030 |
| Coal phase-out and transformation of heat generation assets | Decommissioning of the Ostrołęka B power plant and decarbonisation of the heat generation assets. | Power generation: by the end of 2030; Heat generation: by 2035 |
| Carbon capture, utilisation and storage (CCUS) | Capture of direct CO₂ emissions from own installations through CCUS projects. | By 2035 |
| Renewable and low-carbon hydrogen | Development of production and utilisation of low-carbon and renewable hydrogen (as part of measures undertaken to comply with RED III); actions supported by National Recovery and Resilience Plan funding, contributing to emissions reductions in the Downstream segment. | By 2035 |
Selected transition levers in own operations12


12 In-house analysis based on the ORLEN 2035 Strategy.
Key transition actions of the ORLEN Group to 2035
| Lever | Action | Time horizon |
|---|---|---|
| Renewable energy sources (RES) | Rapid expansion of renewable energy assets in Poland and internationally, including onshore and offshore wind and solar, to achieve a marked increase in installed capacity and renewable energy output. | Ongoing |
| Gas-fired generation (CCGT) | Development of high-efficiency CCGT units to support coal phase-out and, in the longer term, electricity system balancing and integration of growing renewable energy volumes. | Ongoing |
| Energy storage (BESS) | Development of energy storage to enhance electricity system flexibility and support integration of growing renewable energy volumes. | Ongoing |
| Sustainable transport | Increase in the share of renewable energy in the fuel mix through biofuels (including HVO) and low- and zero-carbon electricity. | Ongoing |
| E-mobility | Expansion of the electric vehicle charging network to support emissions reduction in transport and increased use of zero-carbon energy. | Ongoing |
| Biogas and biomethane | Commissioning of a pilot biomethane plant and progressive scaling of secured biomethane volumes. In the longer term, decarbonisation of the value chain through the use of biogas and biomethane in transport and own operations. | Pilot by 2030; scale-up by 2035 |
| Small modular reactors (SMR) | Preparation and development of SMR projects as a stable, zero-carbon energy source supporting long-term decarbonisation. | By 2035 |
| Carbon capture, utilisation and storage (CCUS) | Development of CO₂ storage operations (carbon management services), enabling CO₂ storage for third parties, in line with the Net Zero Industry Act. | By 2035 |
Energy transition financing
Planned capital expenditure under the ORLEN 2035 Strategy will support delivery of the ORLEN Transition Plan. We anticipate cumulative CAPEX and merger and acquisition spending of PLN 350– 380 billion in 2025–2035, covering both growth projects and maintenance of existing assets13.
Approximately 40% of the expenditure will be allocated to low-carbon projects, leading to the creation of a sustainable product portfolio and supporting the implementation of our transition plan.
13 The ORLEN Group is excluded under Article 12 of Commission Delegated Regulation (EU) 2020/1818 of 17 July 2020 supplementing Regulation (EU) 2016/1011 of the European Parliament and of the Council as regards minimum standards for EU Climate Transition Benchmarks and EU Parisaligned Benchmarks.
Breakdown of capital expenditure to 203514

14 Source: ORLEN Transition Plan
Breakdown of capital expenditures by ORLEN’s key activities, in accordance with the Taxonomy classification and NACE codes for oil-, gas- and coal-related activities.
| Segment | ORLEN Group operations | Taxonomy | Oil, gas and coal (according to NACE codes) |
|---|---|---|---|
| CCUS | - | - | |
| Upstream & Supply | Exploration and production of crude oil and gas | - | B.05, B.06, B.09 Limited to crude oil (26% of all total production in year 2025) |
| Wholesale of crude oil and gas | - | - | |
| Production and refinery trade | - | C.19, G46.71 | |
| Production and petrochemical trade | - | - | |
| Biofuels and biogas | CCM 4.13 | - | |
| Downstream | Renewable and low-carbon hydrogen | CCM 3.10, CCM 6.15 | - |
| Chemical and mechanical recycling | CE 2.7 | - | |
| Energy efficiency | CCM 4.25 | - | |
| Commercial power generation (including development of CCGT) | CCM 4.29 | D.35.1 | |
| Energy | Offshore wind (including unconsolidated investments) | CCM 4.3 | - |
| Onshore wind and solar PV | CCM 4.1, CCM 4.3, CCM 4.16, CCM 7.6 | - | |
| Transformation of heat generation assets | CCM 4.11, CCM 4.15, CCM 4.16, CCM 4.20, CCM 4.24, CCM 4.25, CCM 4.30, CCM 4.31 |
D.35.3 Limited to coal
(59% of total production in district heating in year 2025) | |
| Small Modular Reactors SMR | - | - | |
| Storage of electricity | CCM 4.10 | - | |
| Electricity distribution | CCM 4.9 | - | |
| Electricity trading | - | - | |
| Energy services | - | - | |
| Gas distribution | - | - | |
| Fuel retail | - | - | |
| Consumers & Products | E-mobility | CCM 6.15 | - |
| Energy and gas retail | - | - | |
| Non-fuel retail | - | - |
The remaining 60% of capital expenditure relates primarily to the continued development of our natural gas operations, including gas production, import and its use as a fuel in the energy sector, as well as to the maintenance and modernisation of our petrochemical and refining production assets, including the New Chemistry project. It also includes maintenance CAPEX across existing assets in all business segments.
The development of gas-fired power generation (high-efficiency CCGT units) was not classified as low-carbon in the cumulative CAPEX breakdown for 2025–2035 presented in Figure 17. However, these projects contribute to lowering the emissions intensity in energy generation (kg CO₂e/MWh) and the Net Carbon Intensity (NCI, g CO₂e/MJ). They are also eligible under the EU Taxonomy as CCM 4.29 – Electricity generation from fossil gaseous fuels.
At the same time, some investments classified as low-carbon in the cumulative CAPEX breakdown for 2025–2035 in Figure 18 are not included in the CAPEX KPI under the EU Taxonomy. This applies in particular to investments in joint ventures, especially in offshore wind, as well as other transitionenabling activities such as CCUS and initiatives to reduce direct emissions from Upstream & Supply and Downstream assets, including energy efficiency improvements and methane emissions reduction.
To minimise risks associated with inefficient capital allocation, including the risk of locked-in emissions, we have adopted differentiated minimum return thresholds (hurdle rates), calibrated to specific project types.
Minimum return thresholds

The differentiation in capital return expectations reflects the anticipated impact of each project category on the emissions profile. Investments that demonstrably support emissions reduction benefit from more favourable economic evaluation criteria, while projects with a potential to increase the Group’s carbon footprint are subject to more stringent return requirements.
Breakdown of 2025 capital expenditure [PLN billion/%]15
15 The chart presents all capital expenditures, including consolidated and unconsolidated, incurred by the ORLEN Group in 2025.
During the reporting period, our capital expenditure on oil, gas and coal-related activities was as follows:
Capital expenditure related to crude oil, natural gas and coal [PLN million]
| Item | ORLEN Group segment | Activity – NACE code | Maintenance | Growth and M&A |
|---|---|---|---|---|
| Crude oil | Upstream & Supply | B.05, B.06, B.09 | 274 | 1,704 |
| Downstream |
C19
G46.71 |
1,666
559 |
1,147
165 | |
| Gas | Energy | D35.1 | 663 | 887 |
| Coal | Energy | D35.3 | 390 | - |
| Total | 3,552 | 3,903 |
In 2025, we incurred PLN 7,455 million in capital expenditure related to crude oil, natural gas and coal, of which 52% was growth CAPEX and the remainder was maintenance CAPEX. Growth CAPEX was primarily allocated to refining, development of gas-fired generation capacities, and oil production.
For upstream, it was assumed, in line with NACE codes, that upstream activities comprise the production of crude oil. CAPEX related to oil production and auxiliary services was allocated proportionally based on the share of crude oil production in total oil and gas production in 2025 (26%). The remaining crude oil-related CAPEX relates to refining and wholesale of crude oil and petroleum products. Natural gas-related CAPEX reflects investments in gas-fired power generation, notably the construction and expansion of CCGT units. Coal-related CAPEX comprises maintenance expenditure on heat generation assets, allocated proportionally based on the share of coal in the consolidated companies’ total district heating output in 2025, which was 59%.
In 2025, we also incurred significant capital expenditure on low-carbon activities supporting the delivery of our strategic objectives and the ORLEN Transition Plan. This expenditure included in particular spending listed in the table below.
Capital expenditure related to the development of low-carbon activities [PLN million]
| Activities | Maintenance | Growth and M&A | |
|---|---|---|---|
| CCUS | Upstream & Supply | - | 1 |
| Biofuels and biogas | 23 | 696 | |
| Renewable and low-carbon hydrogen | Downstream | 0 | 125 |
| Chemical and mechanical recycling | - | 16 | |
| Energy efficiency improvements | - | 45 | |
| Renewable power generation | 246 | 4,454 | |
| Transformation of heat generation assets | Energy | 267 | 454 |
| Electricity distribution | 165 | 3,075 | |
| E-mobility | Consumers & Products | 1 | 116 |
| Total | 702 | 8,982 |
In 2025, we allocated PLN 9,683 million to low-carbon activities, with 93% of this amount spent on growth projects. The largest share of this expenditure was allocated to the expansion of renewable energy generation assets, including projects carried out through joint ventures (such as Baltic Power), as well as electricity distribution.
Of the total 2025 CAPEX on low-carbon activities supporting the delivery of our strategic objectives and the ORLEN Transition Plan, PLN 3,446 million was related to Taxonomy-aligned activities. Transitional CAPEX included significant investment in the development of gas-fired generation: PLN 1,066 million in total, including PLN 1,044 million for growth projects. While these activities are an important part of our transition plan, under the classification adopted in the ORLEN Transition Plan they are not classified as low-carbon and are included in capital expenditure related to crude oil, natural gas and coal.
Other transitional CAPEX mainly relates to the development of petrochemical production, oil and gas production, trading and distribution of natural gas and the development of retail services.
Qualitative analysis of carbon lock-in
Estimates of potential carbon lock-in associated with our key assets and products are based on projections of future greenhouse gas emissions. Over the long term, petroleum products and natural gas may face declining demand, which may affect the value of assets involved in their extraction, processing and sale, and in extreme cases lead to early asset retirement and carbon lock-in.
We identify carbon lock-in risk as material in our transition risk analysis and climate strategy resilience assessment. This risk is addressed as part of our asset portfolio management, including the assessment of assets related to the production, processing and sale of crude oil and natural gas. The analysis covers both Scope 1 and Scope 2 emissions from assets operated by the Group, and Scope 3 emissions from the use of sold products. Carbon lock-in risk is systematically integrated into our strategic planning and investment decision-making.
Scope 1, Scope 2 and Scope 3 emissions are subject to a reduction pathway aligned with our decarbonisation targets, as set out in the ORLEN Transition Plan, and climate mitigation targets reported in disclosure ESRS E1-4. The pathway includes decarbonisation actions across all business segments that are considered material to emissions intensity of our operations: Upstream & Supply, Downstream and Energy.
As part of the carbon lock-in analysis, for Scope 1 we identified the highest-risk areas of our operations, in line with the CSRD framework and the provisions applicable to activities related to crude oil production and refining, as well as the use of gas and coal in electricity generation.
Key areas the ORLEN Group’s operations in terms of Scope 1 emissions; emissions from the highest-risk areas [million tonnes of CO2e].

The segment’s key activities are the development of the ORLEN Group’s own natural gas production and securing natural gas supplies to Poland. We seek to expand gas production to support the region’s energy transition and enhance energy security, and at the same time respond to increasing demand driven by the phase-out of more carbon-intensive fuels, in particular coal.
The development of liquid hydrocarbon production, primarily crude oil, which accounted for 26% of our total production in 2025, is not currently a strategic priority and is responsible for a relatively small share of our direct emissions.
Accordingly, in the Upstream & Supply segment we do not identify a material risk of carbon lock-in by 2035, given our strong operational focus on minimising emissions of greenhouse gases, particularly methane, through measures aimed at reducing the emissions intensity of our assets and through disciplined investment portfolio management.
Looking ahead to 2050, emissions from upstream activities will largely depend on future demand for hydrocarbons, particularly natural gas. This will determine our exposure to carbon lock-in risk associated with the long-term use of upstream assets under accelerated energy transition scenarios.
Our Downstream segment comprises refining, petrochemical and fertiliser production activities. A significant proportion of emissions in this segment is produced by integrated refining and petrochemical assets.
Looking ahead to 2035, based on projected transport fuel demand in the region, the stable utilisation of our refining capacities, and the measures we undertake to bring down emissions from the Downstream operations, we do not identify a material carbon lock-in risk in this segment, despite the high share of direct emissions associated with refining activities. In line with our strategy, emissions from this segment will be reduced through decarbonisation measures, in particular energy efficiency improvements, electrification, the use of low-carbon energy, and the deployment of carbon capture, utilisation and storage (CCUS) technology.
Over the longer term, to 2050, the level of emissions from conventional refining processes will largely depend on future demand for petroleum-based fuels. At the same time, emissions from our petrochemical and fertiliser production activities may be reduced through the implementation of decarbonisation technologies appropriate for hard-to-abate sectors, including CCUS solutions, process electrification, and the use of zero-carbon hydrogen and its derivatives. Furthermore, crude oil processing is expected to shift towards petrochemical outputs, with a corresponding downscaling of conventional transport fuel production.
At the same time, we support the transformation of the Downstream segment through investments in sustainable transport and petrochemicals aimed at increasing feedstock flexibility. This is intended to reduce our long-term reliance on crude oil as the primary feedstock for transport fuel and petrochemical production and to replace crude oil with alternative feedstocks, including those of biological origin and waste-based feedstocks.
Emissions produced by our Energy segment are associated with heat generation and utility-scale power generation activities. These activities rely on the use of fossil fuels, i.e. coal and natural gas, to generate electricity and heat.
In the Energy segment, we manage carbon lock-in risk by phasing out high-carbon coal assets and developing flexible generation capacity to support the energy transition. The phase-out of coal from power generation by 2030 and the complete elimination of its use in our operations by 2035 significantly reduce the risk of long-term reliance on high-carbon assets.
At the same time, the development of high-efficiency combined-cycle gas turbine (CCGT) units in the short and medium term serves as a transitional solution, enabling the shift away from coal while maintaining security and stability of the power and heat systems. The flexibility of CCGT technology and its role in providing back-up capacity for rapidly expanding renewable energy sources limit carbon lock-in risk in the medium term.
Over the longer term, after 2035, we expect to reduce emissions intensity of our gas-fired assets by adapting them for use with alternative fuels and low- and zero-carbon energy carriers, such as biomethane and hydrogen. This will enhance the resilience of our generation portfolio to long-term transition scenarios and further reduce carbon lock-in risk in the Energy segment.
Scope 3 Category 11 emissions from the combustion of petroleum products in 2025 [million tonnes of CO₂e]
With regard to emissions generated during the use of our products, our approach to emissions reduction, as measured by the Net Carbon Intensity metric, covers greenhouse gas emissions across Scopes 1, 2 and 3, including in particular emissions associated with the use of sold products, i.e. Scope 3 Category 11 emissions. These emissions represent the dominant share of our total emissions profile and are of key importance to achieving our long-term decarbonisation targets.
Reductions in Scope 3 Category 11 emissions are supported primarily through gradual changes in our energy and product mix, including the development of alternative fuels, low- and zero-carbon fuels, as well as increasing the share of renewable and low-carbon energy in our portfolio of products and services. These measures are intended to bring down lifetime emissions of sold products and reduce the risk of locking in high emission levels.
By 2035, taking into account the measures we undertake to maintain current production and sales volumes of liquid hydrocarbons and petroleum-based fuels in line with demand, while transforming 16 For details of the assumptions used in our strategic planning, see ORLEN 2035 Strategy and ORLEN Transition Plan. our product portfolio towards lower-carbon energy products, we do not identify a material risk of carbon lock-in associated with the use of sold products.
At the same time, in the long term, the pace and scale of Scope 3 Category 11 emissions reductions will remain highly dependent on our ability to flexibly adapt our product portfolio to the evolving market demand, consumer behaviours and regulatory frameworks. These factors influence the pace of market uptake of low- and zero-carbon solutions and, consequently, the potential to further reduce emissions associated with the use of sold products over the medium to long term.
Material impacts, risks and opportunities and their interaction with strategy and
business model [E1.SBM-3]
The ORLEN 2035 Strategy and the related ORLEN Transition Plan have been developed in response to the key challenges of the energy transition, including regulatory pressures, shifts in demand patterns, and the need to reduce greenhouse gas emissions across the value chain. Together, these documents define our development priorities and capital allocation directions, enabling us to gradually strengthen the resilience of our business model while maintaining energy security and competitive edge in a changing market environment.
Scenario analysis
To strengthen our organisation’s resilience to a changing external environment, we have embedded scenario analysis as an integral part of our medium- and long-term strategic planning. It serves as a tool supporting strategic decision-making, optimisation of the project portfolio under conditions of uncertainty, and regular updates to macroeconomic assumptions. The analysis covers three differentiated macroeconomic scenarios: a base case, an accelerated transition case and a delayed transition case, which capture alternative decarbonisation pathways, differing, among other things, in the pace of carbon price growth and the associated energy demand trajectory.
In addition, for assessing climate-related risks described in disclosure ESRS2 IRO-1, we considered a scenario aligned with the Paris Agreement, i.e. the low-emission SSP1-1.9 scenario, corresponding to a pathway which assumes keeping global temperature increase to 1.5°, and the high-emission SSP5-8.5 scenario, used for assessing physical risks.
The scenario analysis is based on sector-specific scenarios, enabling assessment of the exposure of our assets and operations to transition risks under different and realistic rates of economic decarbonisation across the region and in the countries where we operate. We use a base-case scenario reflecting current policies corresponding to publicly available reference scenarios: NECM WEM (National Energy and Climate Plan with existing measures) and IEA STEPS (Stated Policies Scenario), which serves as a reference in our strategy definition process16 and in calculating and recognising costs in financial reporting. Furthermore, we apply scenario analysis to assess how climate-related risks and opportunities may affect our operations, strategy, and the long-term resilience of our business model.
The analysis also takes into account elements of an accelerated energy transition, arising from regulations and instruments currently at the implementation stage, as well as the possibility of a delayed energy transition, assuming a slower pace of climate policy implementation and limited effectiveness of regulatory mechanisms.
The findings from the long-term development analyses of our key assets indicate that, in the mediumterm horizon to 2035, the pace of the energy transition in Central Europe will enable the ORLEN Group to strengthen its competitive position through the execution of the ORLEN 2035 Strategy and objectives embedded in the ORLEN Transition Plan. We also used insights from the Climate Neutrality Plans17 developed for selected assets and integrated them into the ORLEN 2035 Strategy and ORLEN Transition Plan.
For the period to 2050, uncertainty remains around the future viability of certain decarbonisation technologies, whose cost-effectiveness will depend on both their scalability and, even more critically, the availability and stability of regulatory support. Based on current long-term analyses, in the period 2036–2050, the macroeconomic environment will be characterised by a high degree of uncertainty in projected supply and demand, commodity prices, regulatory frameworks and support instruments, depending on scenario assumptions.
16 For details of the assumptions used in our strategic planning, see ORLEN 2035 Strategy and ORLEN Transition Plan.
17 Plans prepared in connection with Directive (EU) 2023/959 of the European Parliament and of the Council of 10 May 2023 amending Directive 2003/87/EC establishing a system for greenhouse gas emission allowance trading within the Union and Decision (EU) 2015/1814 concerning the establishment and operation of a market stability reserve for the Union greenhouse gas emission trading system.
The analyses highlight the need for regular updates to strategic assumptions, reflecting developments in technology, regulatory incentives and investment opportunities. Decisions on the ORLEN Group’s future development and the pace of our progress towards climate neutrality will depend on evolving market conditions and regulatory developments.
Key scenarios used by ORLEN in the assessment of climate-related risks and opportunities and in strategic and financial planning
| Role | Scenario name | Source | Scenario time horizon | Increase in global temperature to 2100 | Key assumptions | Impact on ORLEN |
|---|---|---|---|---|---|---|
| Assessment of transition risks and opportunities | SSP1-1.9 | IPCC AR6 | 2100 | ca. 1.5 | A global development path grounded in sustainability principles, strong international cooperation and effective climate policy. Greenhouse gas emissions decline rapidly, with global climate neutrality reached around 2050, followed by the achievement of negative emissions. | Full alignment with the goals of the Paris Agreement and the long-term climate neutrality target by 2050, which, however, entails high costs and the risk of losing competitiveness due to rapid tightening of climate regulations and an abrupt phase-out of fossil fuels, thereby increasing the risk of stranded assets. |
| Macroeconomic environment evolution, strategic and investment planning |
Accelerated transition
Base case Delayed transition | In-house analysis based on sector-specific scenarios | 2060 |
ca. 1.9
ca. 2.5 ca. 3.2 |
Rapid technological progress, strong international cooperation, and the early and effective implementation of ambitious climate policies. This
results in accelerated decarbonisation of energy systems and industry, supported by innovation, high energy efficiency and a substantial increase
in the share of renewables. Climate neutrality is achieved after 2050.
The development pathway is based on current policies and declared commitments, with no material tightening beyond measures already in place. Emissions decline gradually, but the pace of transition is insufficient to meet the goals of the Paris Agreement and keep global warming below 2°C. Delayed and uncoordinated measures to reduce emissions, combined with growing pressure to adapt to the effects of climate change rather than prevent them. Emissions remain high for much of the 21st century, and the transition is turbulent and reactive. |
Rising regulatory costs are partially mitigated by investments in new business lines and decarbonisation, enabled by technological progress, which
safeguards the Group's long-term competitiveness in the low-emission energy sector and increases the alignment of ORLEN's operations with the
Paris Agreement.
Full consistency with the ORLEN 2035 Strategy and the Transformation Plan enables the delivery of key KPIs, as well as the gradual adaptation of the asset portfolio, along with appropriate organizational and technological readiness for deep transition, enabling long-term alignment of the emission reduction pace with the goals of the Paris Agreement. Short-term stabilization of revenues in traditional segments and limitation of regulatory costs, resulting in uncertainty regarding the profitability of investments in low-emission operations and moving away from delivering decarbonization targets and meeting the assumptions of the Paris Agreement. |
| Physical risk assessment | SSP5-8.5 | IPCC AR6 | 2100 | ca. 4.4 | Rapid economic growth and high energy demand, with fossil fuels continuing to dominate the energy mix and no effective global climate policies in place. Greenhouse gas emissions rise throughout the 21st century, and climate neutrality is not achieved. The climate adaptation costs are high due to the materialisation of physical risks. | Limited long-term strategic opportunities resulting from the energy transition process, which hinders the implementation of the Transformation Plan and entails the Group's increasing exposure to the physical effects of climate change and the costs associated with them. |
Description of the processes to identify and assess material climate-related risks and opportunities [E1.IRO-1]
Double materiality assessment summary for climate change [E1.IRO-1]
| Segment | Area | Geographical region |
E1 Risk, opportunity, impact name |
Impact (I)
Risk (R) Opportunity (O) |
Positive (+)
Negative (-) |
Actual (A)
Potential (P) |
Value chain
Organisation (O) Downstream (D) Upstream (U) |
|---|---|---|---|---|---|---|---|
|
Upstream & Supply,
Downstream, Energy, Consumer & Products, Corporate Functions |
Refining;
Upstream; Energy; Petrochemicals; Gas; Retail; Corporate Functions | Europe | Climate change adaptation Costs of measures to mitigate and adapt to climate change (weather-related events and hazards affecting business). | R | O | ||
| Climate change mitigation Ensuring energy security and just transition | I | + | A,P | O,D | |||
| Greenhouse gas emissions | I | - | A,P | O,D,U | |||
| Development of new business segments and business lines with a portfolio of low- and zero-carbon products and services | O | O,D,U | |||||
| Rising costs of measures that support greenhouse gas emissions reduction, including investments in low- and zero-carbon energy sources | R | O,D,U | |||||
| Increased costs of non-compliance with all climate change mitigation regulations | R | O,D,U | |||||
| Europe | Energy Energy-intensive operations | I | - | A,P | O,D,U | ||
| Cost optimisation through reduced energy consumption and improved energy efficiency | O | O,D,U |
| short-term | medium-term | long-term | |||||
|---|---|---|---|---|---|---|---|
| Climate change adaptation | R | ✔ | ✔ | ||||
| Climate change mitigation |
O R |
✔
✔ |
✔
✔ |
✔
✔ | |||
| Energy |
R O |
✔
✔ |
✔
✔ |
The identification and assessment of material climate-related impacts, risks and opportunities form an integral part of our strategic planning. The process includes analyses of potential risks and opportunities arising from the implementation of policies, regulations and mechanisms supporting the transition to a low- and zero-carbon economy, in line with the European Green Deal and the Paris Agreement.
Severity
Given the energy-intensive nature of its business, the ORLEN Group has a significant impact on the climate. This impact stems both from the substantial greenhouse gas emissions generated by our own operations and from emissions arising across the value chain, as reported in disclosure E1-6.
Due to the structure of our business model, the vast majority of our emissions arise outside our direct operations and are classified as Scope 3. Accordingly, we focus not only on reducing Scope 1 and Scope 2 emissions, but also on addressing value chain emissions by reshaping our business portfolio and expanding low- and zero-carbon energy sources. These measures are intended to gradually strengthen our business model’s resilience while ensuring energy security, a just transition, and our competitiveness, in line with the framework described in disclosure E1-1.
Risks and opportunities
In our operations we identified climate-related physical risks that may affect our operational continuity, financial performance and service quality. These risks, described in detail in the section below, are addressed by our climate change adaptation activities.
The identification of transition risks and opportunities related to climate change mitigation and energy is based on a set of key indicators that assess our exposure to risks related to the energy transition, while also enabling the identification of opportunities arising from the shift to a low- and zero-carbon economy. These factors form the basis for further analysis of material impacts, risks and opportunities (IRO) and are used in decision-making processes, including the definition of strategic directions and decarbonisation actions.
The analysis of climate-related risks and opportunities was carried out in line with the recommendations of the Task Force on Climate-related Financial Disclosures (TCFD), and covered the identification, classification and assessment of physical and transition risks and opportunities over the short, medium and long term.
In response to the identified physical risks, we implement adaptation measures to prevent and mitigate the negative impacts of extreme weather events, including prolonged droughts, heat waves, heavy precipitation and storms. These measures are particularly relevant if high-emissions climate scenarios were to materialise, especially SSP5-8.5, which assumes an average global temperature increase of around 4.4°C and entails a greater incidence of both acute and chronic weather-related events in the areas where the ORLEN Group operates and holds assets.
For major capital projects, such as Baltic Power and New Chemistry, we have carried out dedicated climate risk assessments, including physical risk analyses, covering potential materialisation of the risks under the high-emissions SSP5-8.5 scenario.
Material climate-related physical risks
| IRO | Risk type | Climate risk | Key impact | Affected ORLEN Group assets/segments | Adaptation/remedial actions | Time horizon |
|---|---|---|---|---|---|---|
| Implementation of climate change mitigation and adaptation measures | Acute | Extreme temperatures (heat waves, cold waves) | Operational continuity disruptions, reduced infrastructure efficiency and durability, higher failure, insurance and penalty costs | Energy and lighting infrastructure (including in the Energa Group), generation assets, distribution networks, industrial installations | Upgrading infrastructure and using temperature-resistant materials, enhancing maintenance and preventive programmes, adjusting operating parameters, monitoring temperatures and loads | Short to medium term |
| Acute | High winds and storms | Distribution network failures, damage to power lines and support structures, prolonged outages, higher operating costs | Distribution and transmission networks (Energa Operator), energy and industrial infrastructure | Reinforcing support structures and line protection, enhancing vegetation management in power line corridors, network automation and sectionalisation, emergency response planning | Short to medium term | |
| Acute | Heavy precipitation and flooding | Flooding of facilities, operational disruption, physical damage, risk of energy and fuel supply interruptions | Generation, refining and petrochemical assets, distribution infrastructure | Upgrading drainage systems, elevation and protection of critical components, flood barriers, business continuity plans (BCP) | Short to medium term | |
| Chronic | Rising average air temperature | Shorter heating season, lower heat production and sales, changing demand profile. | Heat and power generation assets, heat sales | Diversification of the technology mix (electrification, renewables), efficiency improvements, development of flexible assets and services, business model adaptation | Medium to long term | |
| Chronic | Rising average air temperature | Reduced labour productivity, impacts on employee health | Entire ORLEN Group | Adjustments to working conditions (protective clothing, flexible working hours, access to water and shade) | Medium to long term | |
| Chronic | Hydrological drought | Limited cooling water availability, reduced generation capacity and output, lower revenue | Power plants with open-loop cooling systems, energy assets | Optimisation and modernisation of cooling systems, improved water efficiency, alternative cooling sources, operational planning | Medium to long term | |
| Chronic | Long-term climate change | Need for technological and investment adjustments, higher adaptation costs | Key assets across all segments: Upstream & Supply, Downstream, Energy | Adaptation programmes for key assets, integration of climate risks into capital expenditure planning, scenario analysis, updates to design standards | Long term |
Given the nature of our operations, the most significant climate risks and opportunities are those related to the energy transition, that is climate change mitigation and energy. Those risks and opportunities are addressed through the ORLEN 2035 Strategy, the ORLEN Transition Plan, and our long-term ambition to achieve climate neutrality by 2050.
Our operations continue to rely to a large extent on fossil fuels and, as a result, potential carbon lockin, as described in disclosure E1-1, may make it more difficult to meet long-term climate targets and achieve climate neutrality. This requires consistent transition efforts and the gradual decarbonisation of our asset and product portfolio. Accordingly, our strategic planning is based on an ongoing analysis of transition risks, the macroeconomic outlook, regulatory developments, technological progress and availability, and evolving consumer preferences across the short, medium and long term.
The likelihood of transition risks materialising is assessed using the low-emissions SSP1-1.9 scenario, that is a Paris Agreement-aligned pathway which assumes an accelerated energy transition, limiting the increase in average global temperature to 1.5°C. The materialisation of transition risks and opportunities is closely linked to the European Union’s pursuit of climate neutrality, and affects key aspects of our business, including greenhouse gas emission costs, support mechanisms for renewable energy sources, and the evolution of regional demand for fossil fuels.
The key transition risks identified in relation to our business model are presented below, together with their impact on our strategy and assets, as well as the expected timeframe of their materialisation.
Material transition risks related to climate change mitigation and energy
| IRO | Risk type | Transition risk | Key impact | Affected ORLEN Group assets/segments | Mitigation measures/levers | Time horizon |
|---|---|---|---|---|---|---|
| Increased costs of non-compliance with all climate change mitigation regulations | Regulatory | More stringent climate regulations (e.g. EU ETS 1, EU ETS 2, RED III) | Higher operating and compliance costs, reduced profitability of certain assets, product pricing pressure | Entire ORLEN Group | Integration of carbon costs into financial planning; internal carbon pricing; investment in low- and zero-carbon technologies | Short to medium term |
| Regulatory | Reduction of free emission allowance allocations and EUA price volatility | Increased exposure to price risk, margin pressure | Assets covered by EU ETS (particularly Downstream and Energy) | Portfolio diversification; energy efficiency improvements; development of renewables and CCUS | Short to medium term | |
| Rising costs of measures that support greenhouse gas emissions reduction, including investments in low- and zero-carbon energy sources | Technological | Delays in the development and deployment of decarbonisation technologies | Risk of suboptimal investment decisions, higher capital expenditure, delayed emissions reductions | All segments (particularly Energy and Downstream) | Scenario analysis; phased investment approach; technology partnerships | Medium to long term |
| Technological | Limited availability of key technologies and inputs (CCUS, hydrogen, SMR) | Project delays, cost increases | Energy, Downstream, Upstream & Supply | Supplier diversification; development of in-house capabilities; pilot projects | Medium to long term | |
| Market | Declining demand for conventional fuels | Lower revenue, risk of carbon lock-in, including stranded assets | Downstream, Upstream & Supply, Consumers & Products | Shift in product mix; development of alternative fuels and low-carbon energy | Medium to long term | |
| Market | Increasing competition in low- and zero-carbon products | Margin pressure, need to accelerate investment | Energy, Consumers & Products | Scaling renewable energy capacities; development of e-mobility; product innovations | Medium to long term | |
| Reputational | Risk of greenwashing or failure to meet declared climate targets | Reputational damage, reduced access to financing, stakeholder pressure | Entire ORLEN Group | Transparent ESRS reporting; linking climate targets to remuneration; KPI monitoring | Short to medium term | |
| Reputational | Stigmatisation of the oil and gas sector | Challenges in attracting capital and talent | Entire ORLEN Group | Business diversification; communication of the transition strategy; investment in new business lines | Medium to long term |
In parallel, we identify a range of opportunities related to our efforts to mitigate climate change, including opportunities that may arise from enhanced energy efficiency, expanded use of lowercarbon energy sources, newly developed product and service offerings, entry into new markets, and organisational resilience built through business diversification.
Material opportunities related to climate change mitigation and energy
| IRO | Opportunity type | Opportunity description | Key impact on/value for the Group | Affected segments/assets | Interaction with strategy and business model | Time horizon |
|---|---|---|---|---|---|---|
| Cost optimisation through reduced energy consumption and improved energy efficiency | Operational | Improved energy efficiency, process electrification, optimisation of energy and resource use. | Sustained reduction in operating costs, reduced Scope 1 and Scope 2 emissions, enhanced asset resilience. | Upstream & Supply, Downstream, Energy | Strengthening operational resilience and mitigating EU ETS cost exposure. | Medium to long term |
| Development of new business segments and business lines with a portfolio of low- and zero-carbon products and services | Regulatory | Access to EU support instruments (NRP, Modernisation Fund, Innovation Fund, RED III mechanisms, NZIA) for low- and zero-carbon investments. | Lower cost of capital, improved transition project economics, increased investment. | Energy, Downstream, Consumers & Products | Supporting delivery of the ORLEN 2035 Strategy and the ORLEN Transition Plan, accelerating the development of renewables, hydrogen, CCUS, e-mobility and other low-carbon solutions. | Short to medium term |
| Technological | Development and deployment of low- and zero-carbon technologies (renewables, CCUS, SMR, hydrogen, energy storage). | Increased technological competitiveness, improved operational efficiency, new competencies and revenue streams. | Entire ORLEN Group | Diversification of the technology portfolio and supporting the transition to a multi-energy business model. | Medium to long term | |
| Market | Growing demand for renewable energy, alternative fuels, carbon management services and low-carbon solutions for industry and transport. | Revenue diversification, new business lines, reduced exposure to fossil fuels. | Entire ORLEN Group | Expanding the product offering in line with the energy transition and shifting demand. | Medium to long term | |
| Financial | Preferential financing conditions (green bonds, sustainability-linked loans) for EU Taxonomy-aligned activities. | Improved access to capital, optimised funding structure, enhanced investment attractiveness of the Group. | Entire ORLEN Group | Integrating climate targets into capital allocation and investment decisions. | Short to medium term | |
| Reputational | Strengthening the ORLEN Group's position as one of the key energy suppliers in Central Europe. | Greater stakeholder trust, enhanced attractiveness for investors, partners and employees. | Entire ORLEN Group | Consistent implementation of the climate strategy, transparent ESRS reporting and delivery on decarbonisation targets. | Medium to long term |
Policies related to climate change mitigation and adaptation [E1-2]
The ORLEN Transition Plan, adopted by the ORLEN Management Board in 2025, is a strategic document defining our approach to the energy transition on the path to achieving climate neutrality. It explains how we respond to evolving regulatory and market conditions, supporting the decarbonisation process both within our own operations and across our broader ecosystem through the implementation of key transformation projects.
The ORLEN Transition Plan outlines our strategic directions in the face of global challenges for the sector, providing a detailed overview of the following key areas:
- Approach to energy transition: The ORLEN Group’s strategic approach to the transition and the specific nature of energy transition challenges in Central Europe.
- Decarbonisation strategy: Planned targets and investments aimed at reducing emissions and creating new growth areas for the ORLEN Group, including renewable energy, SMR technologies, diversification of the fuel mix, and the development of CCUS technologies.
- Energy transition financing: Long-term strategy for capital allocation within the Group and approach to financing the transition.
- Just transition: Actions undertaken by the ORLEN Group to ensure a socially just energy transition.
- Climate governance: The management approach to climate and transition-related challenges within the Group, as well as climate advocacy.
| Scope of application | ESRS topics | Standards |
|---|---|---|
| Entire ORLEN Group |
E1. Climate
E5. Resource use S1. Workforce |
EFRAG – Implementation Guidance [draft]
Transition Plan for Climate Change Mitigation TPT (Transition Plan Taskforce) – TPT Oil & Gas Sector Guidance IIGCC - Net Zero Standard for Oil & Gas |
We have developed the ORLEN Group Climate Policy, setting out the measures we are taking on the path to climate neutrality. The document was prepared in line with the recommendations of the Task Force on Climate-related Financial Disclosures (TCFD), which are intended to standardise disclosures on climate risks. The Policy, originally adopted by the Management Board in 2023, was updated and approved in 2025.
It describes our approach to managing climate-related risks and opportunities, including climate change mitigation and adaptation, and sets out the governance structure and the principles for integrating climate matters into decision-making processes, for instance through incentive targets. In addition, the document includes the Ten Climate Governance Principles, providing a framework for engaging in regulatory matters, lobbying activities and social dialogue in relation to greenhouse gas emissions abatement, support for the energy transition, and the delivery of a just transition.
| Scope of application | ESRS topics | Standards |
|---|---|---|
| Entire ORLEN Group | E1. Climate | TCFD (Task Force on Climate-related Financial Disclosures) |
The ORLEN Group Sustainable Development Strategy for 2025–2035, described in detail in disclosure SBM-1, addresses the most significant contemporary market and regulatory challenges identified for the ORLEN Group, in particular climate change, biodiversity and environmental protection, social relations, as well as geopolitical and economic conditions. The document is based on five pillars: Climate, Environment, Employees, Communities and Governance. Within these areas, we have defined targets that directly refer to the United Nations Sustainable Development Goals, the 10 Principles of the UN Global Compact, and the European Sustainability Reporting Standards. The Strategy therefore supports a comprehensive approach to responsible business conduct and ensures consistent and transparent reporting on sustainability matters, including under the CSRD. The Strategy, originally adopted by the Management Board in 2021, was updated and approved in 2025.
Under the Climate pillar, the Sustainable Development Strategy sets out key targets and priorities for reducing greenhouse gas emissions across Scope 1, Scope 2 and Scope 3, including reductions in absolute emissions, improvements in emissions intensity, and the development of low- and zerocarbon technologies, such as renewable energy sources, energy storage, hydrogen, CCUS and emobility.
| Scope of application | ESRS topics | Standards |
|---|---|---|
| Entire ORLEN Group | All topics |
UN Sustainable Development Goals (SDGs)
ESRS (European Sustainability Reporting Standards) |
We undertake climate change mitigation measures in line with the ORLEN S.A. Energy Policy, which sets out the framework for energy management and guides our initiatives to improve energy efficiency and reduce greenhouse gas emissions. The document supports the implementation of the ORLEN 2035 Strategy and the pursuit of climate neutrality through the development of low- and zero-carbon energy sources and the optimisation of energy processes.
The Energy Policy refers to our ISO 50001-compliant Energy Management System, which enables ongoing monitoring of energy consumption, assessment of energy efficiency, and the setting of targets and optimisation measures. This system constitutes the foundation of our approach to energy management and helps us identify and implement projects improving energy efficiency. Under the Energy Policy, we commit to implementing innovative and digital solutions to increase the use of renewable energy, develop low-carbon technologies, and promote environmentally responsible attitudes. These measures contribute to reducing greenhouse gas emissions and to integrating climate considerations into operational decision-making.
| Scope of application | ESRS topics | Standards |
|---|---|---|
| ORLEN S.A. |
E1. Climate,
E2. Pollutants, E5. Resource use and circular economy | ISO 50001 standard |
The ORLEN S.A. Integrated Management System Policy provides an operational framework that facilitates the achievement of our objectives by integrating environmental protection, energy efficiency and climate impact mitigation into day-to-day management and operational processes.
The Policy ensures a consistent approach to managing emissions, energy consumption and environmental risks, and thus supports our decarbonisation strategy and the pursuit of climate neutrality.
Within the Integrated Management System, climate-related issues are addressed through regular monitoring of our environmental and energy performance, continuous process improvement, risk management, and ensuring compliance with applicable regulations and standards, including ISO 14001 and ISO 50001.
| Scope of application | ESRS topics | Standards |
|---|---|---|
| ORLEN SA | All topics | ISO 14001 and ISO 50001 standards |
The implementation of all policies listed above is the responsibility of the ORLEN S.A. Management Board.
Actions and resources in relation to climate change policies [E1-3]
Set out below are the actions we implemented through 2025 to mitigate climate change and limit its impacts, together with projections for the period to 2030 and 2035.
The scope of these disclosures covers a range of measures, encompassing both ongoing investments and planned initiatives arising from our strategies and the ORLEN Transition Plan. They span, among other things, decarbonisation projects within our own operations, as well as initiatives aimed at reducing emissions across our value chain, including Scope 3 emissions.
The delivery of these actions is supported by dedicated capital expenditures described in the ‘Energy transition financing’ section of disclosure E1-1, which are a key factor underpinning the credibility and feasibility of our decarbonisation targets.
reducing methane emissions is one of the key decarbonisation levers for our upstream operations. The measures we implement and the commitments we make are designed to deliver effective emissions reductions while maintaining security of supply and cost efficiency commensurate with the expected environmental benefits.
We are implementing a programme to reduce methane emissions from our upstream and distribution activities, including venting and fugitive emissions. These actions are aligned with the objective of achieving Near-Zero Upstream Methane Emissions by 2030 from operations that are under the control of ORLEN Group companies acting as project operators.
We are deploying advanced technological solutions ensuring flaring efficiency of up to 99%, including infrastructure upgrades and the optimisation of cryogenic processes and methane recovery systems. In parallel, steps are being taken to bring down methane emissions from waste gas streams through innovative technological modifications that enable their effective utilisation instead of release into the atmosphere. With regard to fugitive emissions, we apply a structured and systematic approach to methane emissions management, encompassing the elimination of well venting and a Leak Detection and Repair programme. As part of these measures, we established a comprehensive inventory of methane emission sources, and in 2025 we launched regular leak detection and repair campaigns using advanced detection technologies. Data on the results of measurements and remedial actions are consolidated in a dedicated IT system that supports methane emissions management, helping to sustain the reductions achieved and reinforcing the credibility of our decarbonisation efforts.
| Activities | Emissions scope | Related targets | Implementation status | Reductions achieved | Time horizon | Expected outcome |
|---|---|---|---|---|---|---|
| Reduction of methane emissions | Scope 1 | Oil & Gas NCI | Ongoing | ca. 0.1 million tonnes of CO2e | 2030 |
ca. 0.3 million tonnes of CO2e Near-Zero Upstream Methane Emissions from operations where ORLEN Group companies act as project operators |
In upstream operations ORLEN eliminates routine methane flaring by capturing the methane and using it for energy purposes, including power and heat generation. These actions support our objective of Zero Routine Flaring in upstream operations where ORLEN Group companies hold operatorship by 2030.
In addition, we are taking steps to further eliminate routine flaring, which was historically used where low-quality gas or gas available in limited volumes could not be utilised in an economically viable manner. As part of these measures, waste gas is treated, compressed and transported in order to be placed on the market, used locally for energy purposes or re-injected into the reservoir.
| Activities | Emissions scope | Related targets | Implementation status | Time horizon | Expected outcome |
|---|---|---|---|---|---|
| Elimination of routine flaring | Scope 1 | Oil & Gas NCI | Ongoing | 2030 |
ca. 0.05 million tonnes of CO2e Elimination of emissions from routine flaring in upstream operations where ORLEN Group companies act as project operators |
We pursue energy efficiency improvements as a key lever for reducing greenhouse gas emissions within our own operations. These initiatives, focused on the steady optimisation of technological processes, upgrades of industrial assets and mitigation of energy losses, primarily within the Downstream segment, contribute to reduced consumption of energy utilities and, consequently, to lower Scope 1 and Scope 2 emissions.
As part of these efforts, we deploy solutions such as heat recovery, process electrification, upgrades of energy-intensive equipment, and optimisation of the operating parameters of our units. These measures are implemented both in our existing assets and at the design stage of new projects, enabling a sustained reduction in the energy intensity of our operations while enhancing their competitiveness.
The delivery of energy efficiency initiatives is supported by targeted capital and operating expenditures, alongside a structured approach to energy management, including monitoring of energy consumption and identification of further optimisation opportunities.
| Activities | Emissions scope | Related targets | Implementation status | Reductions achieved | Time horizon | Expected outcome |
|---|---|---|---|---|---|---|
| Energy efficiency improvements | Scope 1 | Oil & Gas NCI | Ongoing | ca. 0.5 million tonnes of CO2e | 2035 |
ca. -1.3 million tonnes of CO2e achieved by optimising energy consumption |
Emissions from our own operations are being reduced through such measures as the decommissioning of carbon-intensive generation capacities, replacing them with low-carbon sources, and increasing the share of renewable and lowcarbon energy, including power and heat.
A key component of these actions is the phase-out of coal from our operations, which involves the discontinuation of coal use at the Ostrołęka B power plant and the gradual transition away from coal in heat generation. As a result, we will phase out coal from power generation by the end of 2030 and from heat generation by 2035.
These actions are implemented in a phased and coordinated manner, aligned with the development of low- and zero-carbon capacities, enabling a reduction of the emissions intensity of our operations while ensuring energy security and continuity of supply. The coal phase-out is a key lever for the ORLEN Group’s decarbonisation, which supports our long-term energy transition. The process is carried out with due consideration of technical and social factors, including the role of heating assets within local energy systems.
| Activities | Emissions scope | Related targets | Implementation status | Reductions achieved | Time horizon | Expected outcome |
|---|---|---|---|---|---|---|
| Coal phase-out from power generation | Scope 1 | Power & Heat NCI | Planned | - | 2030 |
ca. -1.6 million tonnes of CO2e Reduction of emissions from coal-based electricity generation |
| Transformation of heat generation assets, including coal phase-out | Scope 1 | Power & Heat NCI | Ongoing | ca. 0.6 million tonnes of CO2e | 2035 |
ca -3.4 million tonnes of CO2e Reduction of emissions from coal-based cogeneration |
We are building a comprehensive carbon capture, utilisation, transport and storage (CCUS) value chain as one of the key levers for decarbonising our own operations and supporting the transition of hard-to-abate sectors. In this process, we take into account both the maturity of available technologies and the applicable national and regional regulatory frameworks.
CCUS is expected to help reduce CO₂ emissions from our industrial installations, particularly in the Downstream segment, while also establishing a foundation for providing carbon management services to third parties through the development of storage capacity of 4.26 M CO₂ per year, in line with the target set under the Net Zero Industry Act.
In the area of carbon capture and utilisation, we are advancing technologies that reduce direct emissions from our own installations and enable part of the captured CO₂ to be utilised, for instance in the production of synthetic fuels. In parallel, we are building capabilities across the CO₂ management value chain, covering capture, transport and preparation for storage, creating a platform for a gradual expansion of our CCUS activities beyond our own assets and supporting industrial decarbonisation across the region.
Captured carbon dioxide will ultimately be stored in secure geological formations, which means a permanent reduction in atmospheric emissions. Access to our own sequestration sites, consistent with the Net Zero Industry Act, will allow us both to store CO2 captured at our own facilities and to offer carbon management services to third parties.
| Activities | Emissions scope | Related targets | Implementation status | Time horizon | Expected outcome |
|---|---|---|---|---|---|
| Carbon capture | Scope 1 | Oil & Gas NCI | Planned | 2035 | ca. -1.1 million tonnes of CO2e |
| Carbon storage, including as part of carbon management services | Value chain | NCI | Planned | 2035 |
Annual storage capacity of ca. 4.26 million tonnes of CO2e (total for the ORLEN Group and third parties) |
We are developing capabilities for the production and use of renewable and low-carbon hydrogen and its derivatives as a key energy carrier supporting the decarbonisation of our own operations and the production of low-carbon transport fuels. These efforts mainly involve the gradual substitution of conventional hydrogen used in industrial processes with renewable and low-carbon hydrogen. We are investing in various feedstock sourcing options and conversion technologies, including the production of RFNBO and low-carbon hydrogen, to achieve optimal decarbonisation outcomes while minimising regulatory compliance costs.
The development of hydrogen applications is closely linked to investments in new hydrogen production capacities, including electrolysis units powered by renewable energy, as well as in storage and distribution infrastructure. Hydrogen is used primarily in our refining processes and fertiliser production, where it is a significant source of process-related emissions.
In parallel, we are expanding the use of hydrogen in the production of synthetic fuels and as a transport fuel, thereby supporting the decarbonisation of heavy transport. We are also building a hydrogen ecosystem across the entire value chain, from the production of automotive-grade hydrogen, through the development of logistics infrastructure, to the roll-out of dedicated hydrogen refuelling stations. In this way, we contribute to emissions reduction and support sustainable development across the value chain.
| Activities | Emissions scope | Related targets | Implementation status | Time horizon | Expected outcome |
|---|---|---|---|---|---|
| Production and use of renewable and lowcarbon hydrogen and its derivatives | Scope 1 | Oil & Gas NCI | Planned | 2035 |
Ca. -1 million tonnes of CO2e Reduction of direct emissions through technological changes in the production of hydrogen and its derivatives |
We support decarbonisation of the transport sector by diversifying our fuel mix and taking steps to increase the share of low- and zero-carbon energy carriers to 21.1% by 2030 and 26.1% by 2035.
As part of these efforts, we are developing operations in the areas of biofuels, biomethane, synthetic fuels, hydrogen and electricity, enabling the reduction of greenhouse gas emissions both in road transport and in hard-to-electrify sectors such as heavy transport, aviation and maritime transport. A case in point is the construction of an HVO facility in Płock with an annual capacity of 300,000 tonnes, producing biocomponents for diesel oil and aviation fuel. Additionally, we plan to launch Poland’s first next-generation bioethanol unit with an annual capacity of 25,000 tonnes. These solutions facilitate the gradual reduction of Scope 3 emissions while leveraging existing fuel infrastructure.
An essential part of our efforts is the development of infrastructure for the distribution of alternative fuels, in particular e-mobility, through continuing expansion of the network of ultra-fast electric vehicle charging points in Poland and international markets.
These actions are aligned with EU regulations, including the RED II and RED III Directives, and drive energy transition of the transport sector in Central Europe. The implementation of transport decarbonisation measures is supported by capital and operating expenditures, as well as the development of appropriate infrastructure, including the production of low-carbon fuels, logistics, and charging and refuelling infrastructure.
| Activities | Emissions scope | Related targets | Implementation status | Time horizon | Expected outcome |
|---|---|---|---|---|---|
| Sustainable transport | Value chain | NCI | Ongoing |
2030
2035 |
21.1% share of renewable energy in ORLEN transport fuel mix
26.1% share of renewable energy in ORLEN transport fuel mix |
We are advancing gas-fired power generation as a strategic pillar of our energy transition, preserving the stability of the national power system and contributing to emissions intensity improvements in energy generation. High-efficiency combined cycle gas turbine (CCGT) units serve as transitional assets, enabling the phased replacement of the most carbonintensive coal-fired capacities, while ensuring security of supply and strengthening system flexibility in response to the growing penetration of renewable energy sources.
As part of this transition, we are building a portfolio of modern gas-fired assets, including CCGT units in Grudziądz, Ostrołęka, Warsaw and Gdańsk, with the aim of reaching a total installed capacity of 4.3 GW by 2030. These projects enhance the availability of low-carbon dispatchable capacity, supporting the effective balancing of the power system and reducing reliance on high-carbon coalbased generation. Our efforts to develop gas-fired power generation are closely aligned with the coal phase-out process and the ongoing transformation of the heat generation assets.
Natural gas plays a pivotal role in reducing the emissions intensity of our industrial operations, particularly within the Downstream segment, where demand for process heat has traditionally been met by high-carbon sources such as coal and petroleum-derived fuels. Their replacement with natural gas translates into a significant reduction in CO₂ emissions in the short to medium term, while safeguarding operational reliability and continuity.
The development of gas-fired power generation is fully aligned with our long-term decarbonisation pathway, which may involve a gradual reduction of emissions from gas-fired assets through their adaptation to alternative fuels such as biomethane and hydrogen. This approach builds resilience of our generation portfolio to evolving regulatory and market conditions, and ensures that the development of gas-fired power generation remains consistent with the ORLEN Group’s decarbonisation ambitions.
| Activities | Emissions scope | Related targets | Implementation status | Time horizon | Expected outcome |
|---|---|---|---|---|---|
| Embedded generation | Scope 1 | Oil & Gas NCI | Ongoing | 2030 | Ca. -0.8 million tonnes of CO2e |
| Gas-fired generation (CCGT) | Value chain | Power & Heat NCI | Ongoing | 2030 | Growth in energy generation and reduction of emissions intensity |
The development of renewable energy sources is a cornerstone of our energy transition, driving the reduction of greenhouse gas emissions and strengthening energy security across the region. Our efforts are focused on the steady expansion of the installed capacity of our sources in Poland and abroad, including in particular offshore and onshore windfarms and solar PV assets. We target installed capacity expansion to 9 GW by 2030 and 12.8 GW by 2035.
Our flagship initiative is the Baltic Power offshore wind farm, scheduled for commissioning in 2026, complemented by the development of infrastructure for further offshore wind projects. As part of these efforts, we have constructed a dedicated installation terminal in Świnoujście, designed to serve as a strategic logistics hub for offshore wind projects and to support the efficient installation and operation of wind farms in the Baltic Sea. At the same time, we are actively preparing to unlock the potential of our licensed areas in the Baltic Sea, paving the way for the delivery of subsequent offshore projects by 2035, including Baltic East.
The development of renewable power generation enhances the availability of zero-carbon electricity, which is used both to supply the power system and to decarbonise our own operations, including through the production of zero-carbon hydrogen and the electrification of industrial processes.
| Activities | Emissions scope | Related targets | Implementation status | Time horizon | Expected outcome |
|---|---|---|---|---|---|
| Renewable energy sources (RES) | Value chain | Power & Heat NCI | Ongoing | 2035 | Growth in energy generation and reduction of emissions intensity |
We intend to pursue nuclear power development based on small modular reactor (SMR) technology as a key driver of our long-term energy transition and decarbonisation of our operations. Through ORLEN Synthos Green Energy (OSGE), we plan to deploy the BWRX-300 technology – an advanced, reliable and zero-carbon source of electricity supporting decarbonisation of power generation, heat generation and industry.
The development of SMRs is expected to provide stable, zero-carbon generation capacity that will complement the growing share of renewable energy sources, thereby enhancing system flexibility and strengthening energy security. In line with our strategic roadmap, we aim to commission the first SMRs by 2035. SMR-based nuclear power generation is intended primarily to meet our internal energy demand, including in energy-intensive industrial processes, thereby contributing to a sustained reduction in emissions.
| Activities | Emissions scope | Related targets | Implementation status | Time horizon | Expected outcome |
|---|---|---|---|---|---|
| Small modular reactors (SMR) | Value chain | Power & Heat NCI | Planned | 2035 | Growth in energy generation and reduction of emissions intensity |
We plan to develop energy storage capabilities, in particular battery energy storage systems (BESS), as a key enabler of power system stability and the effective integration of a growing share of renewable energy sources.
Energy storage solutions make it possible to balance variable generation from renewable sources, enhance system flexibility and reduce the need to use high-carbon reserve capacities. They support the efficient integration of new renewable capacities into the power system, strengthening our ability to manage generation variability and deliver system services. We are developing energy storage projects both as part of our own generation asset base and in conjunction with grid infrastructure.
In line with our strategy, we target approximately 0.8 GW of installed energy storage capacity by 2030, with further expansion to around 1.6 GW by 2035. Energy storage is seen as an important element complementing our renewable energy portfolio, gas-fired generation as a transitional solution, and SMR-based nuclear power generation within the ORLEN Group’s long-term decarbonisation pathway.
| Activities | Emissions scope | Related targets | Implementation status | Time horizon | Expected outcome |
|---|---|---|---|---|---|
| Energy storage | Value chain | N/A | Ongoing | 2035 | Renewable energy storage capabilities |
Targets related to climate change mitigation and adaptation [E1-4]
Under the ORLEN 2035 Strategy, we have adopted greenhouse gas emissions reduction targets for 2030 and 2035. They reflect our strategic growth priorities and planned transformation pathway, including the allocation of capital expenditure to the energy transition, and form an integral part of the ORLEN Transition Plan.
Delivery of the targets is supported by dedicated investment programmes and operational measures across our key business segments. Given the strategic importance of the energy transition, the decarbonisation targets are regularly monitored and reviewed within our corporate governance framework. Progress against the targets is reported to the management and supervisory bodies and taken into account in decision-making processes.
The ORLEN Group aims to achieve the following emission reduction targets (calculated relative to the 2019 baseline):
GHG emission reduction targets18
| Target | Target value | Scope 1 | Scope 2 (Location-Based)19 | Scope 3 Category 11 | Generated energy volumes | Offset |
|---|---|---|---|---|---|---|
| Target 1 (Oil & Gas) | 2019: base year 17.5 million tonnes CO2e | 16.7 million tonnes CO2e | 0.8 million tonnes CO2e | - | - | - |
| 2025: -7% 16.2 million tonnes CO2e | 15.5 million tonnes CO2e | 0.6 million tonnes CO2e | - | - | - | |
| 2030: -13% | ~15 million tonnes CO2e | ~15 million tonnes CO2e | - | - | - | |
| 2035: -25% | ~13 million tonnes CO2e | ~13 million tonnes CO2e | - | - | - | |
| Target | Target value | Scope 1 | Scope 2 (Location-Based) | Scope 3 Category 11 | Generated energy volumes | Offset |
| Target 2 (Power & Heat) | 2019: base year 377 kg CO2e/MWh | 10.6 million tonnes CO2e | - | - | 28.2 TWh | - |
| 2025: -18% 309 kg CO2e/MWh | 9.8 million tonnes CO2e20 | - | - | 31.7 TWh | - | |
| 2030: -40% ~220 kg CO2e/MWh | ~12 million tonnes CO2e | - | - | ~56 TWh | - | |
| 2035: -55% ~170 kg CO2e/MWh | ~10 million tonnes CO2e | - | - | ~65 TWh | - |
| Target | Target value | Scopes 1 + 2 (Location-Based) | Scope 3 Category 11 | Generated energy volumes | Offset |
|---|---|---|---|---|---|
| Target 3 (Net Carbon Intensity) | 2019: base year 78.6 g CO2e/MJ | 21.5 million tonnes CO2e | 122.3 million tonnes CO2e | 1,856 PJ | - |
| 2025: -2% 77.1 g CO2e/MJ | 21.9 million tonnes CO2e21 | 116.7 million tonnes CO2e | 1,795 PJ | - | |
| 2030: -10% ~70 g CO2e/MJ | ~23 million tonnes CO2e | ~120 million tonnes CO2e | ~2,000 PJ | - | |
| 2035: -15% ~67 g CO2e/MJ | ~21 million tonnes CO2e | ~120 million tonnes CO2e | ~2,100 PJ | ~ -3.2 million tonnes CO2 (carbon management services provided to third parties) |
Emissions reduction targets
Oil & Gas – reduction of absolute Scope 1 and Scope 2 emissions [million tonnes of CO2e]

The Oil & Gas target covers Scope 1 and Scope 2 emissions from hydrocarbon production and oil processing operations under our operational and financial control.
We aim to reduce these emissions by 13% by 2030 and 25% by 2035 relative to the base year, when they totalled 17.5 million tonnes of CO₂e. In 2025, Scope 1 and Scope 2 emissions amounted to 16.2 million tonnes of CO2e, representing a 7% reduction relative to the base year.
The reduction achieved between 2019 and 2025 was driven by:
- Energy efficiency projects implemented at refining and petrochemical production plants (emissions reduction by approximately 0.5 million tonnes of CO₂e),
- Lower emissions from upstream operations (emissions reduction by approximately 0.1 million tonnes of CO₂e),
- Reduction in Scope 2 emissions (by approximately 0.2 million tonnes of CO₂e),
- The remaining reduction was attributable mainly to production optimisation.
Key identified levers for achieving the emission reduction target in our Oil & Gas operations, i.e. the Upstream & Supply and Downstream segments, include:
- Reduction of emissions from upstream operations, to be achieved primarily by cutting methane emissions and eliminating routine gas flaring. In this context, we have adopted two targets for 2030 – Zero Routine Flaring and Near Zero Upstream Methane Emissions – covering all upstream operations under control of ORLEN Group companies acting as the operators;
- Expansion of the use of low-carbon energy by decommissioning integrated generation assets relying on carbon-intensive energy sources and shifting generation towards lower-carbon sources;
- Implementation of energy-efficiency solutions such as heat recovery systems and electrification of production facilities;
- Production and use of renewable and low-carbon hydrogen and its derivatives as a key energy carrier supporting the decarbonisation of our own operations;
- Development of the carbon capture, utilisation and storage (CCUS) technology to reduce emissions from our refining and petrochemical plants;
- Reduction of Scope 2 emissions, i.e. indirect greenhouse gas emissions from the generation of purchased electricity and heat.
Levers for reducing greenhouse gas emissions
| Activities | Emissions scope | Implementation status | Reductions achieved | Time horizon | Expected outcome |
|---|---|---|---|---|---|
| Reduction of methane emissions | Scope 1 | Ongoing | ca. 0.1 million tonnes of CO2e | 2030 | ca. -0.3 million tonnes of CO2e |
| Elimination of routine flaring | Scope 1 | Planned | N/A | 2030 | ca. -0.05 million tonnes of CO2e |
| Embedded generation | Scope 1 | Planned | N/A | 2030 | ca. -0.8 million tonnes of CO2e |
| Energy efficiency improvements | Scope 1 | Ongoing | ca. 0.5 million tonnes of CO2e | 2030 and 2035 | ca. -1.3 million tonnes of CO2e |
| Production and use of renewable and low-carbon hydrogen and its derivatives | Scope 1 | Planned | N/A | 2035 | ca. -1 million tonnes of CO2e |
| Carbon capture | Scope 1 | Planned | N/A | 2035 | ca. -1.1 million tonnes of CO2e |
| Reduction of emissions from purchased energy | Scope 2 | Ongoing | 0.2 million tonnes of CO2e | 2030 and 2035 | ca. -0.3 million tonnes of CO2e |
Power & Heat – reduction of emissions intensity in electricity and heat generation [kg CO2/MWh]

The Power & Heat target covers Scope 1 greenhouse gas emissions from operations contributing to electricity and heat generation that are under the Group’s operational and financial control, as well as emissions and energy generation volumes from joint ventures accounted for using the equity method. This approach ensures alignment with the objectives of the ORLEN 2035 Strategy and the ORLEN Transition Plan, under which the delivery of strategic KPIs in conventional gas-fired generation and renewable energy is supported, among other things, by the development of activities carried out through joint ventures.
We aim to reduce emissions intensity in energy generation by 40% by 2030 and 55% by 2035 relative to the 2019 base year, when it stood at 377 kg CO2e/MWh.
In 2025, the metric was 309 kg CO2e/MWh, down 18% pp versus the base year. The reduction achieved between 2019 and 2025 was attributable to the growth of renewable and gas-fired energy generation, as well as lower utilisation of coal-fired power plants and CHP plants. In particular:
- Emissions from energy generation were down by approximately 0.8 million tonnes of CO₂e, mainly as a result of a reduced use of coal;
- Energy output increased by 3.5 TWh, primarily due to the development of renewable energy sources.
The identified decarbonisation levers for reducing emissions intensity in the Energy segment (kg CO2e/MWh) include:
- Expansion of renewable energy sources, primarily by increasing the installed capacity in offshore and onshore wind projects and solar PV assets;
- Expansion of gas-based power generation, including the construction of highly efficient combinedcycle gas turbine (CCGT) plants to replace the most carbon intensive and least efficient coal-fired units in Poland and strengthen the stability to the national power system amid rapid development of renewable energy generation;
- Coal phase-out in power generation, that is the discontinuation of coal use for electricity generation through the decommissioning of the coal-fired Ostrołęka B power plant by 2030;
- Transformation of the heat generation segment by gradually moving away from coal in cogeneration and transitioning towards natural gas, renewable energy sources such as biomass and biogas, and increased electrification of generation processes;
- Development of small modular reactors (SMRs) – an innovative zero-carbon technology supporting the decarbonisation of power generation, heat generation and industry.
Levers for reducing greenhouse gas emissions
| Activities | Emissions scope | Implementation status | Reductions achieved | Time horizon | Expected outcome |
|---|---|---|---|---|---|
| Renewable energy sources (RES) | Value chain | Ongoing | N/A | 2030 and 2035 | Growth in energy generation and reduction of emissions intensity |
| Gas-fired generation (CCGT) | Value chain | Planned | N/A | 2030 | Growth in energy generation and reduction of emissions intensity |
| Coal phase-out from power generation | Scope 1 | Planned | - | 2030 | ca. -1.6 million tonnes of CO2e |
| Transformation of heat generation assets, including coal phase-out | Scope 1 | Ongoing | ca. -0.6 million tonnes of CO2e | 2030 and 2035 | ca. -3.4 million tonnes of CO2e |
| Small modular reactors (SMRs) | Value chain | Planned | N/A | 2035 | Growth in energy generation and reduction of emissions intensity |
Net Carbon Intensity – reduction of Net Carbon Intensity (NCI) of the ORLEN Group’s energy products [g CO2e/MJ]

The Net Carbon Intensity target covers Scope 1 and Scope 2 emissions from operations related to the production of hydrocarbons and fuels and generation of electricity and heat, as well as Scope 3 Category 11 emissions from the use of our energy products and volumes of energy generated by the ORLEN Group.
We aim to reduce the NCI by 10% by 2030 and 15% by 2035 relative to the 2019 base year, when it stood at 78.6 g CO2e/MJ.
In 2025, the metric was 77.2 g CO2e/MJ, down 2% from the base year. resulting from increased generation of power and heat from low- and zero-carbon sources, as well as the reduction of Scope 1, Scope 2 and Scope 3 emissions.
Identified levers enabling achievement of the Net Carbon Intensity (g CO2e/MJ) target:
- Increased production of low- and zero-carbon energy, driven by investments in the Energy segment and ramp-up of our own natural gas production;
- Development of the production of alternative fuels, including biofuels, synthetic fuels, and automotive-grade hydrogen, capable of effectively replacing conventional petroleum-derived fuels in the transport sector;
- Decarbonisation and optimisation of our own operations, through measures such as energy efficiency improvements, methane emission reductions, capture and storage (CCS) of carbon from our installations, switching to lower-carbon energy sources, and the phase-out of coal in power and heat generation;
- Development of carbon management services, supporting the capture and storage of emissions generated by third parties. The capture and storage of these third-party emissions constitutes a technological offset, making it possible to reduce CO2 emissions beyond our own operations.
Levers for reducing greenhouse gas emissions
| Activities | Emissions scope | Implementation status | Reductions achieved | Time horizon | Expected outcome |
|---|---|---|---|---|---|
| Development of low- and zero-carbon energy generation | Value chain | Ongoing | N/A | 2030 and 2035 | Growth in energy generation and reduction of emissions intensity |
| Development of alternative fuel production | Value chain | Ongoing | N/A | 2030 and 2035 | Growth in energy generation and reduction of emissions intensity |
| Decarbonisation and optimisation of own operations | Scope 1 and Scope 2 | Ongoing | -1.6 million tonnes of CO2e | 2030 and 2035 | ca. -3 million tonnes of CO2e (reduction of Scope 1 and Scope 2 emissions covered by NCI) |
| Carbon management services | Value chain | Planned | N/A | 2035 | ca. -3.2 million tonnes of CO2e (capture and storage of emissions generated by third parties) |
NCI calculation methodology
We have developed a dedicated Net Carbon Intensity (NCI) calculation methodology to measure carbon intensity per unit of energy generated. The largest source of emissions in our value chain is the use of sold products, which is accounted for under Scope 3, Category 11.
Our NCI methodology focuses on key decarbonisation levers deployed within our own operations, as well as on enabling measures that facilitate the energy transition beyond our own operations by reshaping the energy mix and supporting the decarbonisation of industrial sectors.
We adopted a production-based approach, which mitigates the risk of double-counting while capturing all relevant areas and material emissions where future development is expected to most significantly contribute to reducing carbon intensity.
The NCI metric includes direct emissions (Scope 1) – from process-related, technological, and fugitive sources, as well as indirect emissions (Scope 2) produced in the generation of electricity purchased and used in our own operations. Such emissions occur in upstream operations, crude oil refining, and the generation of power and heat from carbon-intensive sources.
The calculations include all emissions from the processes that enable the ORLEN Group to produce energy in the form of liquid fuels, natural gas, electricity and heat, both in operations under operational and financial control of ORLEN Group companies and in companies accounted for with the equity method (joint ventures), but do not include emissions from the production of petrochemicals and fertilisers, as these products do not contribute to energy generation.
NCI also includes the Group’s most material value chain emissions, specifically Scope 3 Category 11 emissions arising from the use-phase of sold products.
Under the production-based approach, the calculations include emissions from the use of natural gas produced in our own operations, and emissions from end-use combustion of fuels produced by all Group refineries.
Our development plans for expanding the natural gas production and increasing output of conventional fuels directly affect the volumes of Scope 3 Category 11 emissions. As such, they have a material impact on the forecast trajectory of our NCI target.
Our activities related to the transport and storage of carbon dioxide (CCUS) that reduce third-party greenhouse gas emissions (carbon management services), are accounted for in the calculations of Net Carbon Intensity (NCI) as a form of technological offset. These avoided emissions are recognised in the numerator of the NCI ratio.
The NCI calculation covers all energy products of the ORLEN Group, including carbon-intensive conventional fuels produced at our refineries, such as diesel oil, gasoline, aviation fuel, and marine fuel, as well as zero-carbon alternatives, including biofuels, automotive-grade hydrogen, and synthetic fuels. It also includes natural gas produced in our upstream operations in Poland, Norway, Canada, and Pakistan.
Additionally, the metric covers electricity and heat generated by the Group from conventional fuels, such as natural gas, and from renewable energy sources, including wind, solar PV, hydropower, biogas, and biomass.
The calculation includes all volumes of energy generated in operations under operational and financial control of ORLEN Group companies, as well as volumes of energy generated by equity-accounted companies (joint ventures).
We adopted 2019 as the base year for our decarbonisation targets. It was selected as a reference point due to the significant external disruptions that occurred in subsequent years, most notably the COVID-19 pandemic, which caused substantial and unforeseen fluctuations in emission levels.
Additionally, in 2020, we announced our Net Zero 2050 ambition and introduced our first interim emission reduction targets.
Following the mergers with ENERGA (April 2020), LOTOS (August 2022), and PGNiG (November 2022), the 2019 base year emissions were recalculated, in line with GHG Protocol guidance, which requires recalculation in the case of significant structural changes. As a result, taking into account emissions from the acquired assets across all three scopes retroactively from 2019, the baseline amounts for emission reduction targets were substantially revised to reflect the significantly expanded emissions boundary.
Scopes 1 and 2 emissions increased primarily due to the expansion of operations in conventional power generation, heat generation and distribution, and refining. Additionally, higher volumes of conventional fuel and natural gas sales contributed to a notable rise in Scope 3 emissions, particularly within Category 11 (use of sold products).
In 2025, adjustments were made to the reported emissions for previous years, as detailed in section E1-6, which resulted in increasing the base-year emissions volume to 17.5 million tonnes of CO₂e for the Oil & Gas target (16.8 as per the 2024 publication) and to 78.6 g CO₂e/MJ for the Net Carbon Intensity target (78 as per the 2024 publication). At the same time, as part of a revision of the reporting methodology, Scope 2 emissions for decarbonisation targets were recalculated using the locationbased approach. The base-year restatement does not affect the percentage emissions reduction targets adopted for 2030 and 2035 and ensures consistency with the data disclosed in the Sustainability Statement based on the current emissions calculations.
Energy consumption and mix [E1-5]
Methodology for calculating energy consumption and mix
Energy consumption data cover all companies referred to in disclosure BP-1. Data on electricity, heat and fuel consumption are obtained from measurement systems operating within production units, ERP systems, operator reports and invoices from energy suppliers. Where complete data are not available, we use estimates based on industry benchmarks and historical data. The collected primary data are converted into final energy using factors aligned with national guidelines and applicable reporting standards.
As part of the reporting process, we identify energy flows between Group companies and subsequently eliminate them in order to avoid double counting of consumption. Energy purchases are classified by supplier and origin, taking into account guarantees of origin and energy mix data published by energy suppliers. Energy generated within the Group is allocated to the appropriate categories based on the source and type of fuel. Own consumption of individual Group companies is determined based on the balance of energy purchased, generated and resold, and is subsequently consolidated at the Group level.
As part of ongoing improvements to the reporting methodology, we made adjustments to the 2024 data on generated electricity volumes and to the method used to determine consumption of energy purchased from outside the organisation for one of the trading companies. The adjustment reduced the generated energy volumes by 14,273 MWh.
In addition, following a refinement of the methodology and in the absence of reliable information confirming the origin of nuclear energy, all energy consumption from nuclear sources reported for 2024 was reclassified as energy purchased or energy from fossil sources. Adjustments were also made to the data on the consumption of purchased or acquired electricity, heat, steam, and cooling from renewable sources. The adjustments followed from a change in the methodology used in the calculations: we applied the market-based approach instead of the location-based approach, in line with the applicable sustainability reporting guidelines. Total energy consumption was revised to include a portion of fuels combusted in refining and petrochemical processes that had been omitted from the previous report, and the classification of gaseous fuel generated in crude oil processing was also changed.
Taken together, all changes made to the 2024 disclosure increased total energy consumption by 843,988 (1%).
Energy consumption and mix
| Energy consumption and mix | UoM | 2025 | 2024 (restated data) | 2024 (data as reported in the annual report) |
|---|---|---|---|---|
| 1) Fuel consumption from coal and coal products | [MWh] | 22,642,545 | 20,753,928 | 20,753,929 |
| 2) Fuel consumption from crude oil and petroleum products | [MWh] | 32,817,358 | 31,608,840 | 24,910,951 |
| 3) Fuel consumption from natural gas | [MWh] | 26,454,503 | 27,904,682 | 33,201,724 |
| 4) Fuel consumption from other fossil sources | [MWh] | 62,948 | 0 | 0 |
| 5) Consumption of purchased or acquired electricity, heat, steam, and cooling from fossil sources | [MWh] | 2,374,419 | 3,507,408 | 1,947,067 |
| 6) Total fossil energy consumption (calculated as the sum of lines 1–5). | [MWh] | 84,351,773 | 83,774,858 | 80,813,670 |
| Share of fossil sources in total energy consumption | [%] | 97% | 97% | 95% |
| 7) Consumption from nuclear sources | [MWh] | 0 | 0 | 412,391 |
| Share of consumption from nuclear sources in total energy consumption | [%] | 0% | 0% | 0.5% |
| 8) Fuel consumption for renewable sources, including biomass (also comprising industrial and municipal waste of biological origin, biogas, renewable hydrogen, etc.) | [MWh] | 1,603,231 | 1,076,858 | 1,076,834 |
| 9) Consumption of purchased or acquired electricity, heat, steam, and cooling from renewable sources | [MWh] | 531,879 | 572,570 | 2,273,942 |
| 10) Consumption of self-generated non-fuel renewable energy | [MWh] | 281,840 | 725,917 | 729,379 |
| 11) Total renewable energy consumption (calculated as the sum of lines 8–10). | [MWh] | 2,416,950 | 2,375,345 | 4,080,154 |
| Share of renewable sources in total energy consumption | [%] | 3% | 3% | 4.8% |
| Total energy consumption (calculated as the sum of lines 6 and 11). | [MWh] | 86,768,723 | 86,150,203 | 85,306,215 |
Non-renewable and renewable energy generation
| Item | UoM | 2025 | 2024 (restated) | 2024 (as reported in the annual report) |
|---|---|---|---|---|
| Non-renewable energy generation | [MWh] | 42,794,555 | 39,309,280 | 40,478,155 |
| Renewable energy generation | [MWh] | 3,784,564 | 2,974,631 | 2,913,435 |
| Net revenue | UoM | 2025 | 2024 (restated) | 2024 (as reported in the annual report) |
| From activities in high climate impact sectors, used to calculate energy intensity | [PLN million] | 267,827 | 294,886 | 294,976 |
| From activities other than in high climate impact sectors | [PLN million] | 0 | 0 | 0 |
| Total net revenue (financial statement) | [PLN million] | 267,827 | 294,886 | 294,976 |
Energy intensity
| Item | UoM | 2025 | 2024 (restated) | 2024 (as reported in the annual report) |
|---|---|---|---|---|
| Total energy consumption | [MWh] | 86,768,723 | 86,150,203 | 85,306,215 |
| Energy intensity (total energy consumption to net revenue) | [MWh/PLN million] | 324 | 292 | 289 |
Gross Scopes 1, 2, 3 and Total GHG emissions [E1-6]
The reporting boundary for the ORLEN Group’s greenhouse gas emissions is the same as that used in the ORLEN Group’s consolidated financial statements, and is described in disclosure BP-1. Compared with 2024, the organisational boundaries were adjusted in line with changes in the ORLEN Group organisation and structure. The allocation of the carbon footprint by business segment was also revised to reflect the new management structure of the ORLEN Group.
In 2025, the Scope 3 emissions data for 2024, originally reported as estimates based on 2023 data and revenue-based indicators (2023 vs 2024), were replaced with emissions calculated using actual operational data and literature-based emission factors, in accordance with the GHG Protocol. At the time of release of the 2024 Sustainability Statement, Scope 3 emissions were not compliant with the GHG Protocol due to data availability constraints. In this Sustainability Statement both the 2025 emissions and the restated 2024 data are compliant with the GHG Protocol and ESRS.
The year-on-year differences are mainly attributable to:
- a review and development of new questionnaires for collecting more comprehensive operational data from individual companies;
- disclosure of the full biogenic emissions for fuels containing biocomponents outside the scopes::
- for Scope 1 purposes, biogenic emissions from the combustion of biogenic components in gasoline (10% bioethanol) and diesel oil (7% FAME) were calculated and reported outside Scope 1 for the Group as a whole, and biogenic emissions associated with purchased and used electricity, heat, steam and cooling were disclosed without excluding them from total Scope 1 emissions;
- for Scope 3 purposes, biogenic emissions were excluded from Scope 3 Category 11 and presented separately;
- changes in the classification of purchased fuel depending on fuel use (own consumption: Scope 3 Category 3; resale: Scope 3 Category 1); fuels consumed by the Group, i.e. burned or used in the production process, were included in Category 3 in 2025 (in 2024 they were included in Category 1);
- allocation of transport of fuels used for own consumption to Scope 3 Category 3.
Differences between the 2024 and 2025 Scope 1 and Scope 2 carbon footprint results are mainly due to a change in the approach to collecting, processing and consolidating emissions data. In 2024, the calculations were performed using Excel spreadsheets, which involved a greater degree of manual data processing, more limited automation of quality controls, and a higher risk of inconsistencies in the way individual entities reported and aggregated data. In 2025, a new database tool was implemented, enabling more structured and consistent management of input data, automation of part of the validation process, standardisation of the calculation logic, and a more complete reflection of the reporting boundary. In effect, the results for 2025 and previous years are based on a more mature and systematic calculation process, which may have affected the reported emission amounts compared with the previous years.
For on-site wastewater treatment plants, we adopted the formulas provided in the IPCC 2019 Refinement Guidelines. Scope 3 emissions based on primary data from suppliers and value chain partners accounted for less than 0.1% of total data in 2025; the remaining calculations were based on annually updated literature-based emission factors.
The calculation process was carried out in accordance with the following methodologies:
- GHG Protocol Corporate Standard (Scope 1),
- GHG Protocol Scope 2 Guidance (Scope 2),
- GHG Protocol Scope 3 Standard (Scope 3).
Sector-specific guidance issued by the American Petroleum Institute (API), International Petroleum Industry Environmental Conservation Association (IPIECA) and International Association of Oil & Gas Producers (IOGP) was also used to reflect the specific characteristics of emissions in the oil and gas sector. Data were collected using dedicated Excel templates, and calculations were performed in a database tool that automatically retrieved the source data.
Regulated Scope 1 greenhouse gas emissions [tonnes of CO₂e]
| Scope 1 – direct CO2 emissions, including: | 2025 | 2024 (restated) | 2024 (as reported in the annual report) |
|---|---|---|---|
| Regulated CO2 emissions | 23,836,422.99 | 23,144,917.43 | 22,768,539 |
| Percentage share | 92% | 92% | 91% |
| Non-regulated CO2 emissions | 2,211,927.83 | 2,063,047.72 | 1,976,480 |
| Percentage share | 8% | 8% | 9% |
| Greenhouse gas category | Scope 1 [t CO2e] | ||
| CO2 | 24,866,605.93 | ||
| CH4 | 1,109,582.84 | ||
| N2O | 84,286.13 |
Scope 1 and Scope 2 GHG emissions (two reporting perspectives) [tonnes of CO₂e]
| Item | 2025 | 2024 (restated) | 2024 (as reported in the annual report) | ||||||
|---|---|---|---|---|---|---|---|---|---|
| Scope 1 |
Scope 2 market-based |
Scope 2 location-based | Scope 1 |
Scope 2 market-based |
Scope 2 location-based | Scope 1 |
Scope 2 market-based |
Scope 2 location-based | |
| Consolidated group for ORLEN Group accounting purposes | 24 157 655,57 | 2 605 467,89 | 1 663 936,33 | 23 266 698,14 | 2 964 581,30 | 2 181 150,02 | N/A | N/A | N/A |
| Emisssions from non-consolidated subsidiaries (not consolidated with the full method for accounting purposes) | |||||||||
| 1 539 316,51 | 351 520,91 | 228 292,48 | 1 561 057,77 | 342 168,74 | 236 966,71 | N/A | N/A | N/A |
| 4,88 | 24 953,38 | 23 463,66 | 5,52 | 35 123,72 | 31 684,23 | N/A | N/A | N/A |
| 351 373,86 | 52 832,42 | 2 864,67 | 380 203,73 | 61 098,58 | 6 054,57 | N/A | N/A | N/A |
| Emissions of the consolidated group for accounting purposes and emissions from non-consolidated subsidiaries (not consolidated with the full method for accounting purposes) | 26 048 350,82 | 3 034 774,60 | 1 918 557,14 | 25 207 965,16 | 3 402 972,34 | 2 455 855,53 | N/A | N/A | N/A |
| ORLEN Group + Rafineria Gdańska (70% interest) | 24 745 019 | 2 510 274 | 1 764 913 | ||||||
Scope 3 GHG emissions by category
| Scope 3 greenhouse gas emissions categories [t CO2e] | 2025 |
2024 (restated data) |
2024 (data as reported in the annual report) |
|---|---|---|---|
| 1. Purchased goods and services (upstream) | 19 733 787,52 | 21 486 068,86 | 8 819 551 |
| 2. Capital goods (upstream) | 16 134 806,33 | 14 348 510,66 | 0 |
| 3. Fuel- and energy-related activities (not included in Scope 1 or Scope 2) | 11 538 033,83 | 8 644 970,50 | 4 058 523 |
| 4. Upstream transportation and distribution (upstream) | Immaterial categories | Immaterial categories | 447 393 |
| 5. Waste generated in operations (upstream) | 9 548 | ||
| 6. Business travel (upstream) | 703 | ||
| 7. Employee commuting (upstream) | 0 | ||
| 8. Upstream leased assets (upstream) | 0 | ||
| 9. Downstream transportation (downstream) | 396 747 | ||
| 10. Processing of sold products (downstream) | 3 489 240,12 | 5 622 229,92 | 5 726 192 |
| 11. Use of sold products (downstream) | 162 290 001,70 | 159 917 239,88 | 139 095 870 |
| 12. End-of-life treatment of sold products (downstream) | Immaterial categories | Immaterial categories | 0 |
| 13. Downstream leased assets (downstream) | 0 | ||
| 14. Franchises (downstream) | 0 | ||
| 15. Investments (downstream) | 0 | ||
| Total | 213 185 869,50 | 210 019 019,82 | 158 554 527 |
Total GHG emissions by value chain level [tonnes of CO₂e]
| Value chain level in a given year | Total greenhouse gas emissions (market-based method) | Total greenhouse gas emissions (location-based method) | ||||
|---|---|---|---|---|---|---|
| 2025 |
2024
(restated data) |
2024
(data as reported in the annual report) | 2025 |
2024
(restated data) |
2024
(data as reported in the annual report) | |
| Upstream emissions (Scope 3, categories 1, 2, 3) | 47 406 627,68 | 44 479 550,02 | 13 335 718 | 47 406 627,68 | 44 479 550,02 | 13 335 718 |
| Own operations (Scope 1 + 2) | 29 083 125,43 | 28 610 937,49 | 27 255 293 | 27 966 907,96 | 27 663 820,68 | 26 509 932 |
| Downstream emissions (Scope 3, categories 10, 11) | 165 779 241,82 | 165 539 469,80 | 145 218 809 | 165 779 241,82 | 165 539 469,80 | 145 218 809 |
| Total greenhouse gas emissions | 242 268 994,93 | 238 629 957,31 | 185 809 820 | 241 152 777,46 | 237 682 840,50 | 185 064 459 |
Emissions intensity indicators
| Metric | UoM | 2025 | 2024 (restated data) | 2024 (data as reported in the annual report) |
|---|---|---|---|---|
| Net revenue as disclosed in the ORLEN Group consolidated financial statements | [PLN million] | 267 827 | 294 886 | 294 976 |
| GHG emissions intensity metric (market-based) | [t CO2e/PLN million] | 904.57 | 809.23 | 629.92 |
| GHG emissions intensity metric (location-based method) | [t CO2e/PLN million] | 900.41 | 806.02 | 627.39 |
Emissions intensity calculated as gross GHG emissions to net revenue as disclosed in the ORLEN Group consolidated financial statements.
ORLEN Group carbon footprint by operating segment [tonnes of CO2e]
| ORLEN Group operating segments | Scope 1 |
Scope 2 market-based |
Scope 2 location-based | Scope 3 |
|---|---|---|---|---|
| Upstream & Supply | 1 407 019,99 | 116 348,50 | 45 883,42 | 33 222 690,49 |
| Downstream | 14 271 848,88 | 1 499 785,17 | 985 434,32 | 101 333 656,68 |
| Energy | 10 342 908,24 | 1 360 130,20 | 851 963,51 | 15 484 301,86 |
| Consumers & Products | 14 011,92 | 48 614,60 | 28 620,64 | 63 089 942,25 |
| Corporate Functions | 12 561,79 | 9 896,13 | 6 655,25 | 55 278,22 |
| Total | 26 048 350,82 | 3 034 774,60 | 1 918 557,14 | 213 185 869,50 |
Biogenic CO₂ emissions from the combustion or biodegradation of biomass (Scope 1, Scope 2 and Scope 3) [tonnes of CO₂e]
| Scope 1 | Scope 2 market-based | Scope 2 location-based | Scope 3 |
|---|---|---|---|
| 826,778.94 | 17,582.19 | 17,582.19 | 3,736,579.86 |
GHG removals and GHG mitigation projects financed through carbon credits [E1-7]
During the reporting period, we did not use any GHG removal and storage projects in our own operations, within the value chain or outside the value chain. In addition, we did not identify any carbon credits outside the value chain that had been cancelled or were planned to be cancelled.
In the short and medium term, we expect to use CCU and CCS technologies as measures to reduce greenhouse gas emissions.
As we continue to develop our decarbonisation strategy, we will assess the potential use of technological offsets, including CCU and CCS, as well as nature-based offsets, particularly in the context of the long-term target of achieving climate neutrality.
Any broader use of offset instruments, including carbon credits, by 2050 will be considered only to the extent provided for and on the terms set out under European Union regulations, taking into account the conditions formally established in applicable and future legislation and regulatory guidance.
Internal carbon pricing [E1-8]
We have mechanisms in place that support the allocation of capital towards low- and zero-carbon investments. One of the key instruments is the incorporation of the cost of CO₂ emissions into financial and strategic planning for activities covered by the EU ETS. As a result, the cost of emissions becomes a material factor in assessing the economic viability of new projects and influences both investment and strategic decision-making across the Group.
The carbon prices we use in strategic planning are consistent with those applied for the purpose of financial reporting, for instance to determine the useful lives of assets, perform impairment tests, and assess the economic viability of potential acquisitions in relation to assets covered by the EU ETS.
The internal carbon pricing mechanism is primarily used to assess the impact of new investments on Scope 1 emissions, particularly in areas covered by the EU ETS, which account for over 90% of the ORLEN Group’s direct emissions. With this approach, we can evaluate the project’s likely performance under future conditions, with tightening regulations and rising allowance prices, and select solutions aligned with our decarbonisation targets and long-term climate strategy.
For the purposes of strategic planning, we apply internally-developed assumptions regarding future CO₂ prices, reflecting the trajectory of the EU climate policy. They are based on three scenarios: base case, accelerated transition, and delayed transition, which differ primarily in the pace of allowance price growth and energy consumption pathways. The assumptions are intended to reduce the impact of short-term market volatility and provide a clearer view of the long-term trend.
We assume a continued increase in EUA prices under the EU ETS in the longer term, consistent with the EU’s objective of achieving climate neutrality by 2050. Under the base scenario, this implies:
- an increase in prices to approximately EUR 120/tonne of CO₂ by 2030;
- a further rise to over EUR 250/tonne of CO₂ around 2040;
- followed by growth towards approximately EUR 350/tonne of CO₂ by 2050.
At the same time, we are monitoring the development of the new EU ETS 2 system, which will cover part of Scope 3 emissions, particularly those related to road transport and buildings. Given the early implementation stage of ETS 2, we are currently assessing its potential impact and progressively incorporating it into our financial and strategic planning processes.
| Type of internal carbon pricing |
Emissions volume
[t CO2] 2025 | Emissions scope | Price (EUR/t CO2) in the base case scenario | |||
|---|---|---|---|---|---|---|
| 2026 | 2030 | 2040 | 2050 | |||
| CO2 emission allowances | 23 836 422,99 | 92% of Scope 1 | ca. 86 | ca. 120 | ca. 250 | ca. 350 |